Introduction
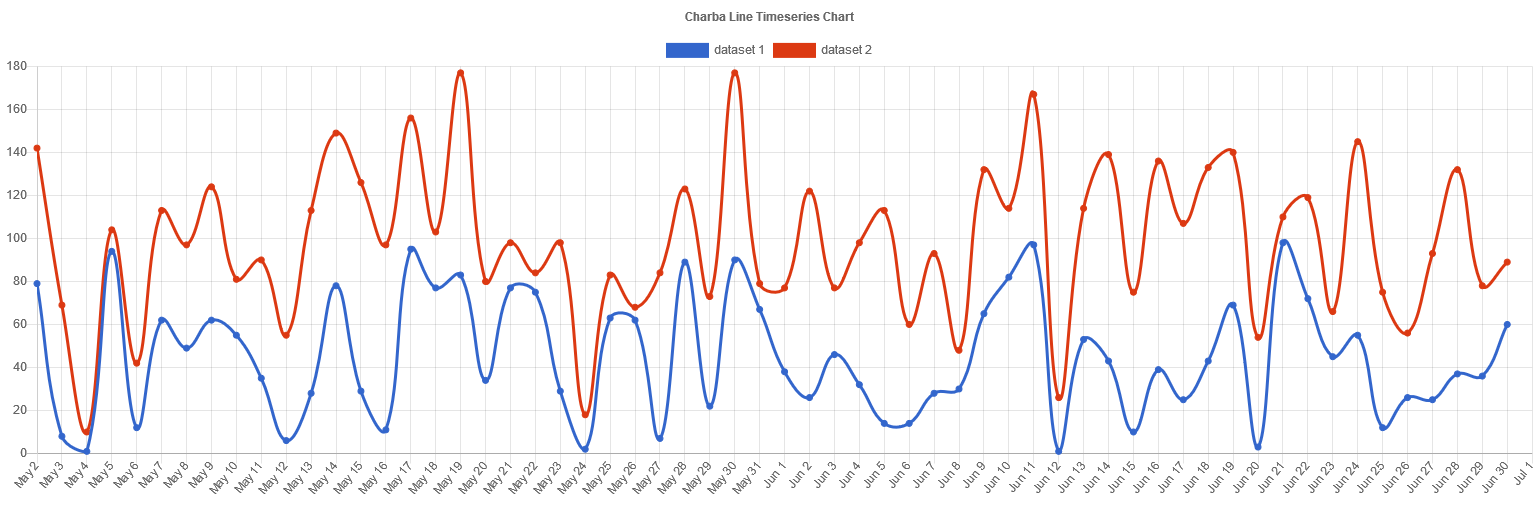
Axes are an integral part of a chart. They are used to determine how data maps to a pixel value on the chart. In a cartesian chart, there is 1 or more X axes and 1 or more Y axes to map points onto the 2 dimensional canvas. These axes are know as 'cartesian axes'.

Axes that follow a cartesian grid are known as 'Cartesian Axes'. Cartesian axes are used for line, bar, scatter and bubble charts.