Annotation plugin
Charba provides out of the box the feature to enable Annotation which can add annotations on a chart instance.
It can draw lines, boxes, points and ellipses on the chart area.
The annotation plugin work with line, bar, scatter and bubble charts that use linear, logarithmic, time or category scales.
The annotation plugin will not work on any chart that does not have exactly two axes, including pie, radar and polar area charts.
Activation
The annotation plugin is injected directly in the document.
The plugin ID is a constant everywhere available, AnnotationPlugin.ID, in AnnotationPlugin entry point.
This plugin registers itself globally, meaning that once injected, all charts will display annotations. In case you want it enabled only for a few charts, you can enable it as following:
// --------------------------------------
// enabling the plugin without any parameter
// the plugin is NOT registered to all charts
// --------------------------------------
AnnotationPlugin.enable();

// --------------------------------------
// enabling the plugin with `true` parameter
// the plugin is registered to all charts
// --------------------------------------
AnnotationPlugin.enable(true);
To activate the plugin in a specific chart, it's enough to provide the configuration options (see below) or enabling it by:
// --------------------------------------
// ENABLING the plugin to a chart instance
// storing a plugin options
// --------------------------------------
// creates a plugin options
AnnotationOptions options = new AnnotationOptions();
// sets default draw time
options.setDrawTime(DrawTime.BEFORE_DRAW);
// stores the plugin options directly by the options
options.store(chart);

// --------------------------------------
// ENABLING the plugin to a chart instance
// by a boolean using default plugin
// options
// --------------------------------------
chart.getOptions().getPlugins().setEnabled(AnnotationPlugin.ID, true);
Configuration
The plugin options can be changed at 2 different levels and are evaluated with the following priority:
- per chart by
chart.getOptions().getPlugins().setOptionsmethod - or globally by
Defaults.get().getGlobal().getPlugins().setOptionsmethod
The configuration AnnotationOptions class is the entry point of plugin configuration.
// -------------------------
// CONFIGURES the annotation
// by AnnotationId id
// -------------------------
// creates a plugin options
AnnotationOptions options = new AnnotationOptions();
// creates an annotation
LineAnnotation line = new LineAnnotation();
... // additional label configuration
// sets the line annotation to the options
options.setAnnotations(line);
// stores the plugin options directly by the options
options.store();
You can also change the default for all charts instances, as following:
// creates a plugin options
AnnotationOptions options = new AnnotationOptions();
// creates an annotation
LineAnnotation line = new LineAnnotation();
... // additional label configuration
// sets the line annotation to the options
options.setAnnotations(line);

// --------------------------------------
// STORING plugin options
// --------------------------------------
// stores the plugin options by plugin ID
Defaults.get().getGlobal().getPlugin().setOptions(AnnotationPlugin.ID, options);
// stores the plugin options without plugin ID
Defaults.get().getGlobal().getPlugin().setOptions(options);
// stores the plugin options directly by the options
options.store();
If you need to read the plugin options, there is the specific factory, AnnotationOptionsFactory as static reference inside the AnnotationPlugin entry point which can be used to retrieve the options from chart as following:
// gets options reference
AnnotationOptions options;

// --------------------------------------
// GETTING plugin options from chart
// --------------------------------------
if (chart.getOptions().getPlugin().hasOptions(AnnotationPlugin.ID)){
   // retrieves the plugin options by plugin ID
   options = chart.getOptions().getPlugin().getOptions(AnnotationPlugin.ID, AnnotationPlugin.FACTORY);
   //retrieves the plugin options without plugin ID
   options = chart.getOptions().getPlugin().getOptions(AnnotationPlugin.FACTORY);
}
Identifier
Every annotation configuration can be add to the AnnotationOptions, assigning a unique identifier.
The identifier of a label configuration can be set by a string or by a specific class, AnnotationId.
// -------------------------
// CONFIGURES the annotation
// by AnnotationId id
// -------------------------
// creates a plugin options
AnnotationOptions options = new AnnotationOptions();
// creates annotation id
AnnotationId annotationId = AnnotationId.create("myAnnotation1");
// creates and adds a line annotation by "myAnnotation1" id
LineAnnotation line = new LineAnnotation(annotationId);
// configures the line annotation
line.setDrawTime(DrawTime.AFTER_DATASETS_DRAW);
line.setBorderColor(HtmlColor.BLACK);
line.setBorderWidth(5);
... // additional label configuration
// sets the line annotation to the options
options.setAnnotations(line);
// stores the plugin options directly by the options
options.store();
If the annotation id is not provided, a unique id for the annotation is created automatically, which can be retrieve by getId() method of the annotation.
You can access to the configured annotations configurations as following:
// ------------------------
// GETS the configured
// annotations
// ------------------------
// retrieves the plugin options by plugin ID
AnnotationOptions options = chart.getOptions().getPlugin().getOptions(AnnotationPlugin.FACTORY);
// gets all annotations configurations
List<AbstractAnnotation> allAnnotations = options.getAnnotations();
// gets "myAnnotation1" annotation configuration
AbstractAnnotation annotation1 = options.getAnnotation(AnnotationId.create("myAnnotation1"));
// gets "myAnnotation2" annotation configuration
AbstractAnnotation annotation2 = options.getAnnotation("myAnnotation2");
Options
The configuration class AnnotationOptions contains all properties needed to configure the plugin.
// creates a plugin options
AnnotationOptions options = new AnnotationOptions();
// sets default draw time
options.setDrawTime(DrawTime.BEFORE_DRAW);
The following options are available at the top level. They apply to all annotations unless they are overwritten on a per-annotation basis:
| Name | Type | Default | Description |
|---|---|---|---|
| drawTime | DrawTime | DrawTime.AFTER_DATASETS_DRAW | Defines when the annotations are drawn. This allows positioning of the annotation relative to the other elements of the graph. |
| dblClickSpeed | int | 350 | Double-click speed in milliseconds used to distinguish single-clicks from double-clicks whenever you need to capture both. When listening for both click and dblclick, click events will be delayed by this amount. |
| events | Event[] | Defaults.get().getGlobal().getEvents() | The events option defines the browser events that the plugin should listen to. This overrides the options at chart level. |
Draw time
The DrawTime option for an annotation determines where in the chart life cycle the drawing occurs. Four potential options are available:
| Option | Description |
|---|---|
| BEFORE_DRAW | Occurs before any drawing takes place |
| BEFORE_DATASETS_DRAW | Occurs after drawing of axes, but before data sets |
| AFTER_DATASETS_DRAW | Occurs after drawing of data sets but before items such as the tooltip |
| AFTER_DRAW | After other drawing is completed. |
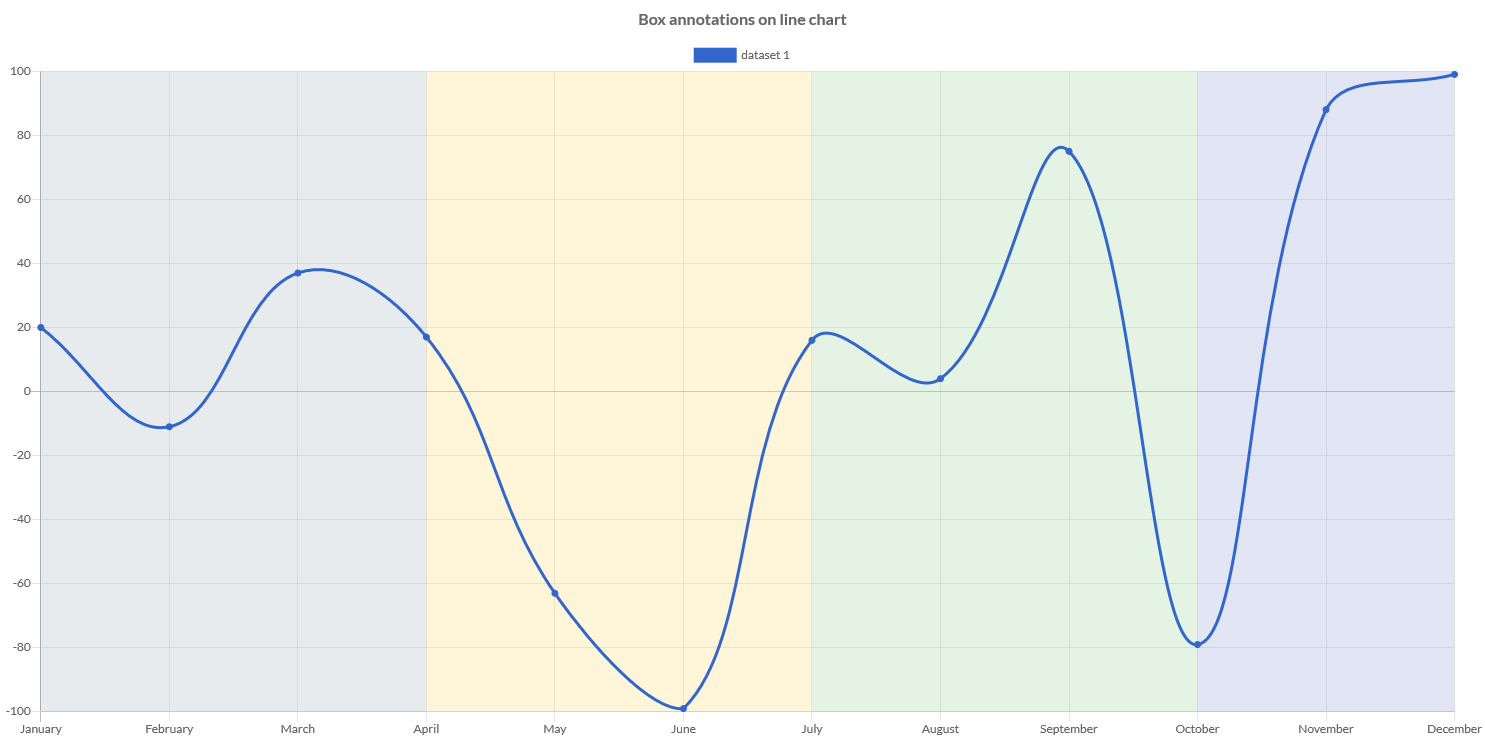
Box
Box annotations are used to draw rectangles on the chart area. This can be useful for highlighting different areas of a chart.
Every plugin options can have an unlimited number of boxes annotations.
// creates a plugin options
AnnotationOptions options = new AnnotationOptions();
// creates an annotation
// without id (a unique one is created automatically)
BoxAnnotation box = new BoxAnnotation();
box.setDrawTime(DrawTime.BEFORE_DATASETS_DRAW);
box.setXScaleID(DefaultScaleId.X);
box.setYScaleID(DefaultScaleId.Y);
box.setXMin("January");
box.setXMax("April");
box.setBackgroundColor(GwtMaterialColor.YELLOW_LIGHTEN_3.alpha(0.3D));
box.setBorderWidth(0);
// stores the annotation in the main options
options.setAnnotations(box);
If one of the axes does not match an axis in the chart, the box will take the entire chart dimension.
The 4 coordinates, xMin, xMax, yMin, yMax are optional. If not specified, the box is expanded out to the edges in the respective direction.
The complete options are described by following table:
| Name | Type | Default | Scriptable | Description |
|---|---|---|---|---|
| adjustScaleRange | boolean | true | Yes | If true, the scale range should be adjusted if this annotation is out of range. |
| backgroundColor | String - IsColor | Defaults.get().getGlobal().getColorAsString() | Yes | The fill color of the box. See default colors. |
| borderColor | String - IsColor | Defaults.get().getGlobal().getColorAsString() | Yes | The stroke color of the box. See default colors. |
| borderDash | int[] | [] | Yes | The length and spacing of dashes. See MDN. |
| borderDashOffset | double | 0 | Yes | The offset for line dashes. See MDN. |
| borderWidth | int | 1 | Yes | The stroke width of the box. |
| cornerRadius | int | 0 | Yes | The radius in pixels of box rectangle. |
| display | boolean | true | Yes | Whether or not this annotation is visible. |
| drawTime | DrawTime | DrawTime. AFTER_DATASETS_DRAW | Yes | Defines when the annotation is drawn. This allows positioning of the annotation relative to the other elements of the graph. |
| xMax | String - double - Date | null | Yes | Right edge of the box in units along the x axis. |
| xMin | String - double - Date | null | Yes | Left edge of the box in units along the x axis. |
| xScaleID | String - ScaleId | DefaultScaleId.X | - | The ID of the X scale to bind onto. |
| yMax | String - double - Date | null | Yes | Top edge of the box in units along the y axis. |
| yMin | String - double - Date | null | Yes | Bottom edge of the box in units along the y axis. |
| yScaleID | String - ScaleId | DefaultScaleId.Y | - | The ID of the Y scale to bind onto. |
Box scriptable options
Some options also accept a callback which is called at runtime and that takes the context as single argument, see here the details, which is representing contextual information and chart instance.
// creates a plugin options
AnnotationOptions options = new AnnotationOptions();
// creates an annotation
BoxAnnotation box = new BoxAnnotation();
// sets callback for border width options
box.setBorderWidth(new WidthCallback<AnnotationContext>(){

   @Override
   public Integer invoke(DatasetContext context){
      // logic
      return borderWidth;
   }
});
// stores the annotation in the main options
options.setAnnotations(box);
The following options can be set by a callback:
| Name | Callback | Returned types |
|---|---|---|
| adjustScaleRange | AdjustScaleRangeCallback | boolean |
| backgroundColor | ColorCallback<AnnotationContext> | String - IsColor - Pattern |
| borderColor | ColorCallback<AnnotationContext> | String - IsColor |
| borderDash | BorderDashCallback<AnnotationContext> | List<Integer> |
| borderDashOffset | BorderDashOffsetCallback<AnnotationContext> | double |
| borderWidth | WidthCallback<AnnotationContext> | int |
| cornerRadius | CornerRadiusCallback<AnnotationContext> | int |
| display | DisplayCallback<AnnotationContext> | boolean |
| drawTime | DrawTimeCallback | DrawTime |
| xMax | ValueCallback | String - double - Date |
| xMin | ValueCallback | String - double - Date |
| yMax | ValueCallback | String - double - Date |
| yMin | ValueCallback | String - double - Date |
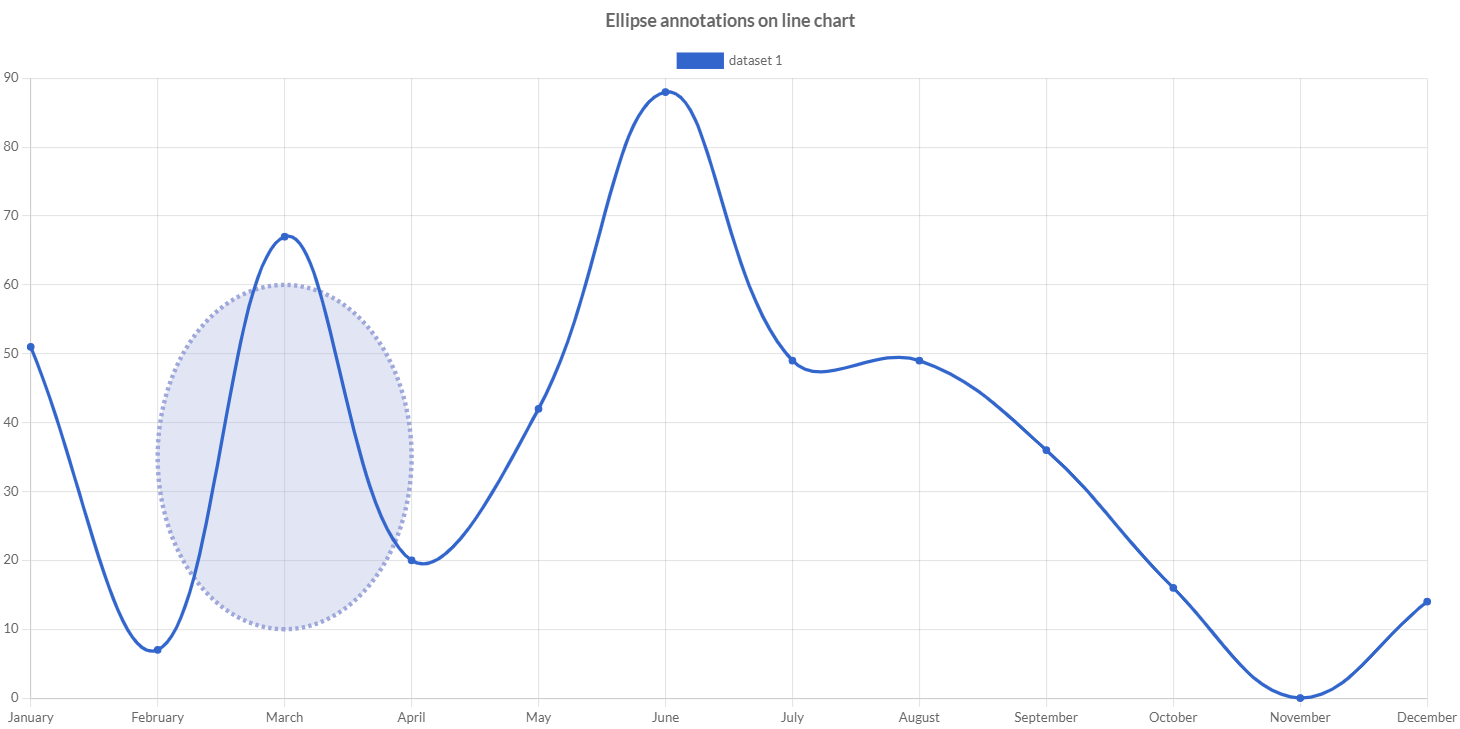
Ellipse
Ellipse annotations are used to draw ellipses on the chart area. This can be useful for highlighting different areas of a chart.
Every plugin options can have an unlimited number of ellipses annotations.
// creates a plugin options
AnnotationOptions options = new AnnotationOptions();
// creates an annotation
// without id (a unique one is created automatically)
EllipseAnnotation ellipse = new EllipseAnnotation();
ellipse.setDrawTime(DrawTime.BEFORE_DATASETS_DRAW);
ellipse.setXScaleID(DefaultScaleId.X);
ellipse.setYScaleID(DefaultScaleId.Y);
ellipse.setXMin("February");
ellipse.setXMax("April");
ellipse.setYMin(10);
ellipse.setYMax(60);
ellipse.setBackgroundColor(GwtMaterialColor.INDIGO_LIGHTEN_3.alpha(0.3D));
ellipse.setBorderWidth(4);
ellipse.setBorderColor(GwtMaterialColor.INDIGO_LIGHTEN_3);
ellipse.setBorderDash(3,3);
// stores the annotation in the main options
options.setAnnotations(ellipse);
If one of the axes does not match an axis in the chart, the ellipse will take the entire chart dimension.
The 4 coordinates, xMin, xMax, yMin, yMax are optional. If not specified, the ellipse is expanded out to the edges in the respective direction.
The complete options are described by following table:
| Name | Type | Default | Scriptable | Description |
|---|---|---|---|---|
| adjustScaleRange | boolean | true | Yes | If true, the scale range should be adjusted if this annotation is out of range. |
| backgroundColor | String - IsColor | Defaults.get().getGlobal().getColorAsString() | Yes | The fill color of the ellipse. See default colors. |
| borderColor | String - IsColor | Defaults.get().getGlobal().getColorAsString() | Yes | The stroke color of the ellipse. See default colors. |
| borderDash | int[] | [] | Yes | The length and spacing of dashes. See MDN. |
| borderDashOffset | double | 0 | Yes | The offset for line dashes. See MDN. |
| borderWidth | int | 1 | Yes | The stroke width of the ellipse. |
| display | boolean | true | Yes | Whether or not this annotation is visible. |
| drawTime | DrawTime | DrawTime. AFTER_DATASETS_DRAW | Yes | Defines when the annotation is drawn. This allows positioning of the annotation relative to the other elements of the graph. |
| xMax | String - double - Date | null | Yes | Right edge of the ellipse in units along the x axis. |
| xMin | String - double - Date | null | Yes | Left edge of the ellipse in units along the x axis. |
| xScaleID | String - ScaleId | DefaultScaleId.X | - | The ID of the X scale to bind onto. |
| yMax | String - double - Date | null | Yes | Top edge of the ellipse in units along the y axis. |
| yMin | String - double - Date | null | Yes | Bottom edge of the ellipse in units along the y axis. |
| yScaleID | String - ScaleId | DefaultScaleId.Y | - | The ID of the Y scale to bind onto. |
Ellipse scriptable options
Some options also accept a callback which is called at runtime and that takes the context as single argument, see here the details, which is representing contextual information and chart instance.
// creates a plugin options
AnnotationOptions options = new AnnotationOptions();
// creates an annotation
EllipseAnnotation ellipse = new EllipseAnnotation();
// sets callback for border width options
ellipse.setBorderWidth(new WidthCallback<AnnotationContext>(){

   @Override
   public Integer invoke(DatasetContext context){
      // logic
      return borderWidth;
   }
});
// stores the annotation in the main options
options.setAnnotations(ellipse);
The following options can be set by a callback:
| Name | Callback | Returned types |
|---|---|---|
| adjustScaleRange | AdjustScaleRangeCallback | boolean |
| backgroundColor | ColorCallback<AnnotationContext> | String - IsColor - Pattern |
| borderColor | ColorCallback<AnnotationContext> | String - IsColor |
| borderDash | BorderDashCallback<AnnotationContext> | List<Integer> |
| borderDashOffset | BorderDashOffsetCallback<AnnotationContext> | double |
| borderWidth | WidthCallback<AnnotationContext> | int |
| display | DisplayCallback<AnnotationContext> | boolean |
| drawTime | DrawTimeCallback | DrawTime |
| xMax | ValueCallback | String - double - Date |
| xMin | ValueCallback | String - double - Date |
| yMax | ValueCallback | String - double - Date |
| yMin | ValueCallback | String - double - Date |
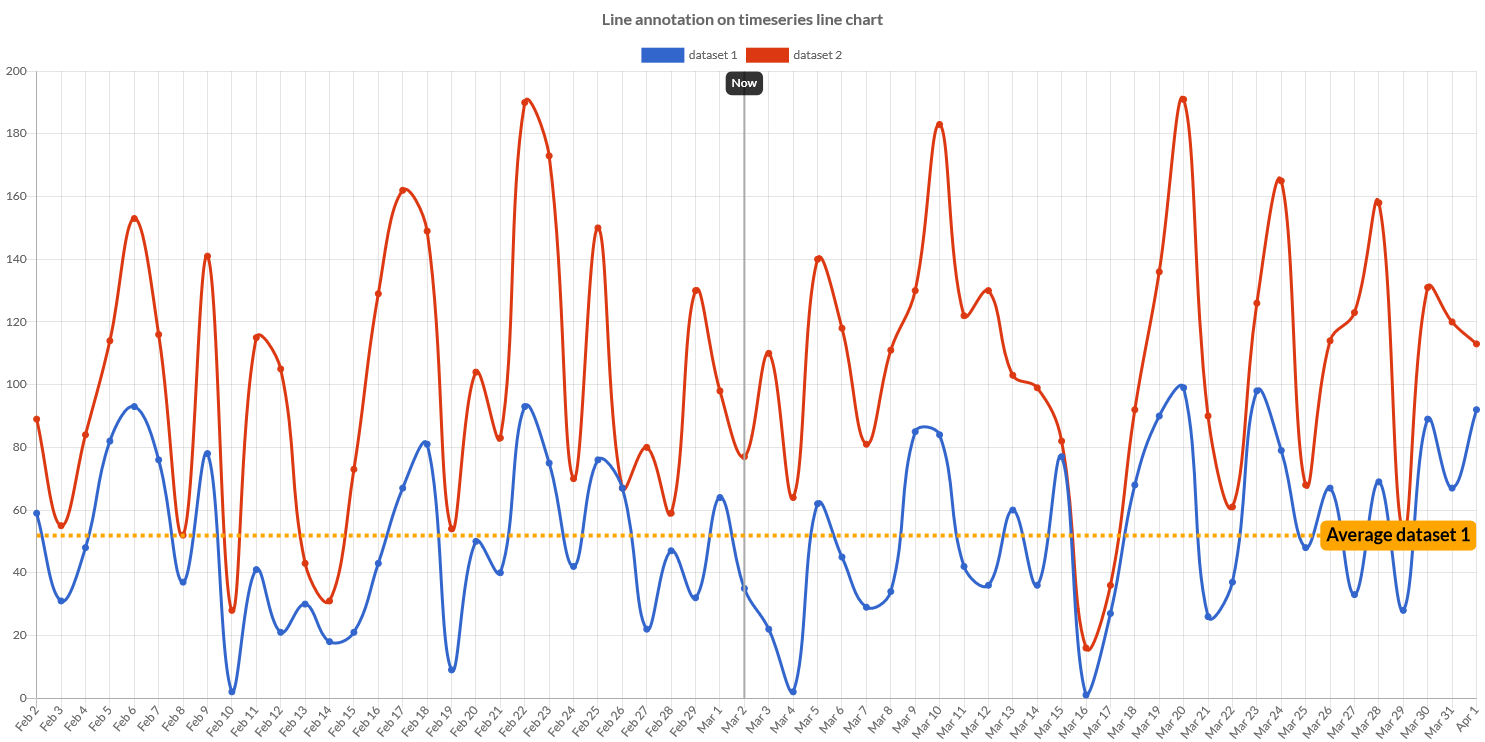
Line
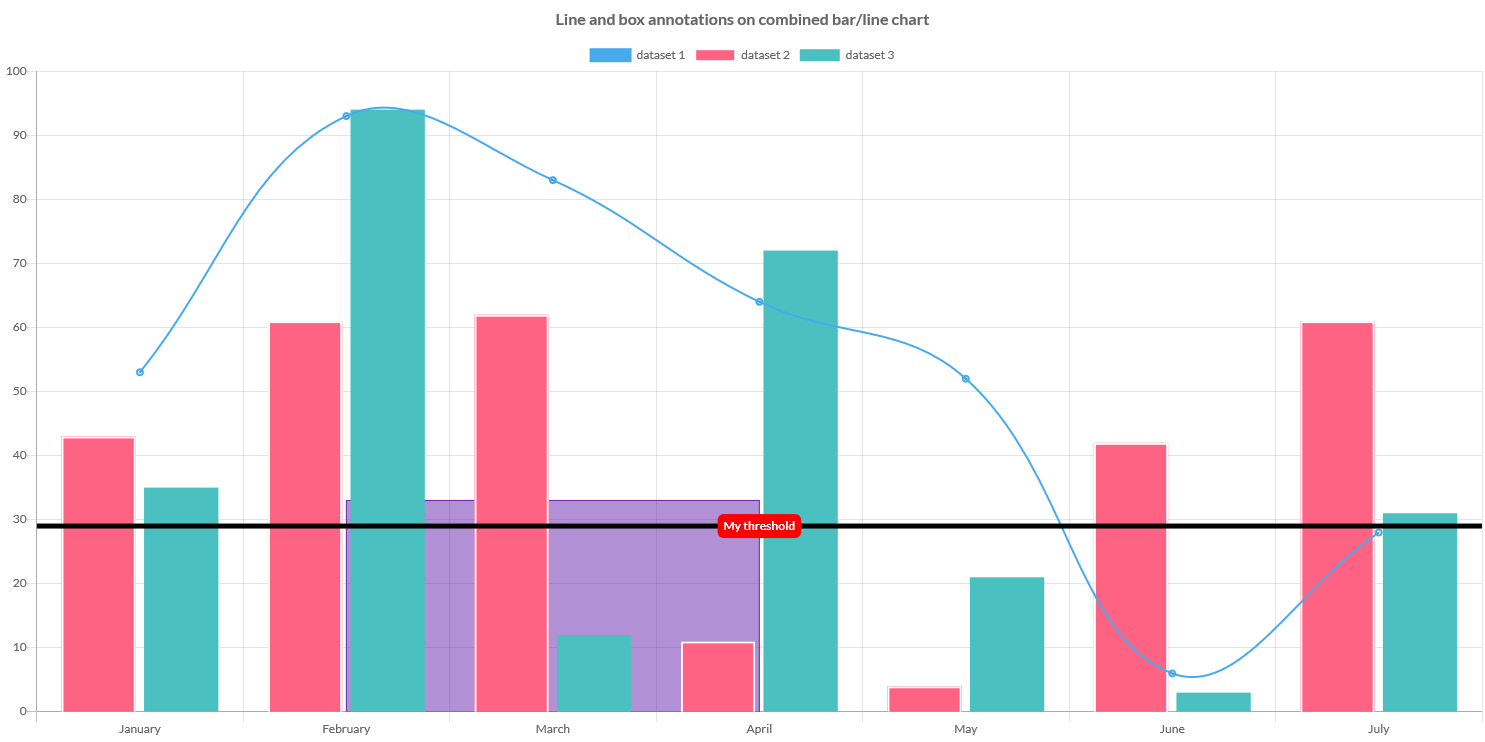
Line annotations are used to draw lines on the chart area. This can be useful for highlighting information such as a threshold.
Every plugin options can have an unlimited number of lines annotations.
// creates a plugin options
AnnotationOptions options = new AnnotationOptions();
// creates an annotation
// without id (a unique one is created automatically)
LineAnnotation line = new LineAnnotation();
line.setDrawTime(DrawTime.AFTER_DRAW);
line.setScaleID(DefaultScaleId.X.value());
line.setBorderColor(HtmlColor.DARK_GRAY);
line.setBorderWidth(2);
line.setValue(new Date());
// sets label configuration
line.getLabel().setDisplay(true);
line.getLabel().setContent("Now");
line.getLabel().setPosition(LabelPosition.START);
// stores the annotation in the main options
options.setAnnotations(line);
If one of the axes does not match an axis in the chart, the line will take the entire chart dimension.
The 4 coordinates, xMin, xMax, yMin, yMax are optional. If not specified, the line is expanded out to the edges in the respective direction.
The line can be positioned in two different ways:
- if
scaleIDis set, thenvalueandendValuemust also be set to indicate the end points of the line. The line will be perpendicular to the axis identified byscaleID. - if
scaleIDis unset, thenxScaleIDandyScaleIDare used to draw a line from(xMin, yMin)to(xMax, yMax).
The complete options are described by following table:
| Name | Type | Default | Scriptable | Description |
|---|---|---|---|---|
| adjustScaleRange | boolean | true | Yes | If true, the scale range should be adjusted if this annotation is out of range. |
| borderColor | String - IsColor | Defaults.get().getGlobal().getColorAsString() | Yes | The stroke color of the line. |
| borderDash | int[] | [] | Yes | the line dash pattern used when stroking lines, using an array of values which specify alternating lengths of lines and gaps which describe the pattern. |
| borderDashOffset | int | 0 | Yes | Offset for line dashes. See MDN |
| borderWidth | int | 1 | Yes | The stroke width of the line. |
| display | boolean | true | Yes | Whether or not this annotation is visible. |
| drawTime | DrawTime | DrawTime. AFTER_DATASETS_DRAW | Yes | Defines when the annotation is drawn. This allows positioning of the annotation relative to the other elements of the graph. |
| endValue | String - double - Date | null | Yes | End two of the line when a single scale is specified. |
| scaleID | String - ScaleId | DefaultScaleId.Y | - | ID of the scale in single scale mode. If unset, xScaleID and yScaleID are used. |
| value | String - double - Date | null | Yes | End one of the line when a single scale is specified. |
| xMax | String - double - Date | null | Yes | X coordinate of end two of the line in units along the x axis. |
| xMin | String - double - Date | null | Yes | X coordinate of end one of the line in units along the x axis. |
| xScaleID | String - ScaleId | DefaultScaleId.X | - | The ID of the X scale to bind onto. |
| yMax | String - double - Date | null | Yes | Y coordinate of end one of the line in units along the y axis. |
| yMin | String - double - Date | null | Yes | Y coordinate of end one of the line in units along the y axis. |
| yScaleID | String - ScaleId | DefaultScaleId.Y | - | The ID of the Y scale to bind onto. |
Line scriptable options
Some options also accept a callback which is called at runtime and that takes the context as single argument, see here the details, which is representing contextual information and chart instance.
// creates a plugin options
AnnotationOptions options = new AnnotationOptions();
// creates an annotation
LineAnnotation line = new LineAnnotation();
// sets callback for border width options
line.setBorderWidth(new WidthCallback<AnnotationContext>(){

   @Override
   public Integer invoke(DatasetContext context){
      // logic
      return borderWidth;
   }
});
// stores the annotation in the main options
options.setAnnotations(line);
The following options can be set by a callback:
| Name | Callback | Returned types |
|---|---|---|
| adjustScaleRange | AdjustScaleRangeCallback | boolean |
| borderColor | ColorCallback<AnnotationContext> | String - IsColor |
| borderDash | BorderDashCallback<AnnotationContext> | List<Integer> |
| borderDashOffset | BorderDashOffsetCallback<AnnotationContext> | double |
| borderWidth | WidthCallback<AnnotationContext> | int |
| display | DisplayCallback<AnnotationContext> | boolean |
| drawTime | DrawTimeCallback | DrawTime |
| endValue | ValueCallback | String - double - Date |
| value | ValueCallback | String - double - Date |
| xMax | ValueCallback | String - double - Date |
| xMin | ValueCallback | String - double - Date |
| yMax | ValueCallback | String - double - Date |
| yMin | ValueCallback | String - double - Date |
Label
A line annotation can have a label to draw on the line.
Every line annotation can have ONLY 1 label.
// creates a plugin options
AnnotationOptions options = new AnnotationOptions();
// creates an annotation
// without id (a unique one is created automatically)
LineAnnotation line = new LineAnnotation();
// sets label configuration
line.getLabel().setDisplay(true);
line.getLabel().setContent("My threshold");
line.getLabel().setBackgroundColor(HtmlColor.RED);
// stores the annotation in the main options
options.setAnnotations(line);
The complete options are described by following table:
| Name | Type | Default | Scriptable | Description |
|---|---|---|---|---|
| autoRotation | boolean | false | - | If true, the rotation option is ignored and the label uses the degrees of the line. |
| backgroundColor | String - IsColor | rgba(0,0,0,0.8) - | Yes | Background color of the label container. |
| color | String - IsColor | #fff - | Yes | The text color of the label. |
| content | String - String[] - Img | null | Yes | The content to show in the label. Provide an array to display values on a new line. |
| cornerRadius | int | 6 | Yes | The radius of label box in pixels. |
| display | boolean | false | Yes | Whether or not the label is shown. |
| drawTime | DrawTime | See description | - | Defines when the label is drawn. Defaults to the line annotation draw time if unset. |
| font | Font | See description | Yes | The text font of the label. The default value is the global font with the style set to FontStyle.BOLD. See Font. |
| imageHeight | int - String | Undefined.INTEGER - null | Yes | Overrides the height of the image. Could be set in pixel by a number, or in percentage of current height of image by a string. If uset, uses the height of the image. It is used only when the content is an image. |
| imageWidth | int - String | Undefined.INTEGER - null | Yes | Overrides the width of the image. Could be set in pixel by a number, or in percentage of current width of image by a string. If unset, uses the width of the image. It is used only when the content is an image. |
| position | LabelPosition | LabelPosition.CENTER | Yes | Anchor position of label on line. |
| rotation | double | 0 | Yes | The rotation of label, in degrees. |
| textAlign | TextAlign | TextAlign.CENTER | Yes | Horizontal alignment on the label content when is set as a multiple lines text. |
| xAdjust | double | 0 | Yes | Adjustment along x-axis (left-right) of label relative to computed position. Negative values move the label left, positive right. |
| xPadding | int | 6 | Yes | Padding of label to add left/right. |
| yAdjust | double | 0 | Yes | Adjustment along y-axis (top-bottom) of label relative to computed position. Negative values move the label up, positive down. |
| yPadding | int | 6 | Yes | Padding of label to add top/bottom. |
Label scriptable options
Some options also accept a callback which is called at runtime and that takes the context as single argument, see here the details, which is representing contextual information and chart instance.
// creates a plugin options
AnnotationOptions options = new AnnotationOptions();
// creates an annotation
LineAnnotation line = new LineAnnotation();
// sets callback for background color options
line.getLabel().setBackgroundColor(new ColorCallback<AnnotationContext>(){

   @Override
   public IsColor invoke(DatasetContext context){
      // logic
      return color;
   }
});
// stores the annotation in the main options
options.setAnnotations(line);
The following options can be set by a callback:
| Name | Callback | Returned types |
|---|---|---|
| backgroundColor | ColorCallback<AnnotationContext> | String - IsColor - Pattern |
| color | ColorCallback<AnnotationContext> | String - IsColor |
| content | ContentCallback | String - List<String> - Img |
| cornerRadius | CornerRadiusCallback<AnnotationContext> | int |
| display | DisplayCallback<AnnotationContext> | boolean |
| font | FontCallback<AnnotationContext> | FontItem |
| imageHeight | ImageSizeCallback | String - int |
| imageWidth | ImageSizeCallback | String - int |
| position | LabelPositionCallback | LabelPosition |
| rotation | RotationCallback<AnnotationContext> | double(1) |
| textAlign | TextAlignCallback<AnnotationContext> | TextAlign |
| xAdjust | AdjustSizeCallback | double |
| xPadding | PaddingSizeCallback | int |
| yAdjust | AdjustSizeCallback | double |
| yPadding | PaddingSizeCallback | int |
(1)To enable autoRotation by the rotation callback, the value to return must be Double.NaN.
// sets callback for auto rotation
line.getLabel().setRotation(new RotationCallback<AnnotationContext>(){

   @Override
   public Double invoke(DatasetContext context){
      return Double.NaN; // autoRotation is set
   }
});
Point
Point annotations are used to mark points on the chart area. This can be useful for highlighting values that are of interest.
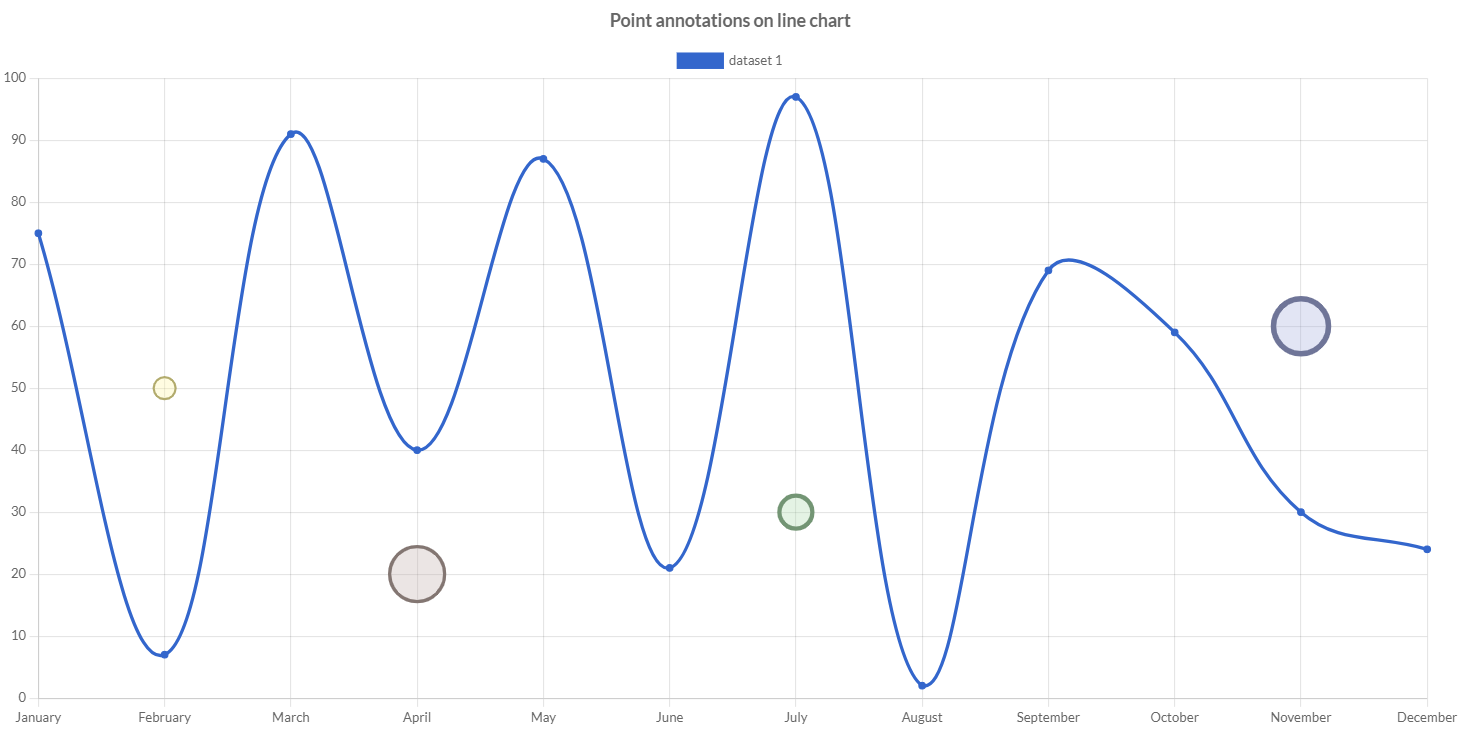
Every plugin options can have an unlimited number of points annotations.
// creates a plugin options
AnnotationOptions options = new AnnotationOptions();
// creates an annotation
// without id (a unique one is created automatically)
PointAnnotation point = new PointAnnotation();
// sets annotation configuration
point.setXScaleID(DefaultScaleId.X);
point.setYScaleID(DefaultScaleId.Y);
point.setXValue("February");
point.setYValue(50);
point.setRadius(10);
point.setBackgroundColor(HtmlColor.YELLOW.alpha(0.3D));
point.setBorderWidth(2);
point.setBorderColor(HtmlColor.YELLOW.darker());
// stores the annotation in the main options
options.setAnnotations(point);
The complete options are described by following table:
| Name | Type | Default | Scriptable | Description |
|---|---|---|---|---|
| adjustScaleRange | boolean | true | Yes | If true, the scale range should be adjusted if this annotation is out of range. |
| backgroundColor | String - IsColor | Defaults.get().getGlobal().getColorAsString() | Yes | The fill color of the point. See default colors. |
| borderColor | String - IsColor | Defaults.get().getGlobal().getColorAsString() | Yes | The stroke color of the point. |
| borderDash | int[] | [] | Yes | The line dash pattern used when stroking lines, using an array of values which specify alternating lengths of lines and gaps which describe the pattern. |
| borderDashOffset | int | 0 | Yes | Offset for border dashes. See MDN |
| borderWidth | int | 1 | Yes | The stroke width of the point. |
| display | boolean | true | Yes | Whether or not this annotation is visible. |
| drawTime | DrawTime | DrawTime. AFTER_DATASETS_DRAW | Yes | Defines when the annotation is drawn. This allows positioning of the annotation relative to the other elements of the graph. |
| radius | double | 10 | Yes | Size of the point in pixels. |
| xValue | String - double - Date | null | Yes | X coordinate of the point in units along the x axis. |
| xScaleID | String - ScaleId | DefaultScaleId.X | - | The ID of the X scale to bind onto. |
| yValue | String - double - Date | null | Yes | Y coordinate of the point in units along the y axis. |
| yScaleID | String - ScaleId | DefaultScaleId.Y | - | The ID of the Y scale to bind onto. |
Point scriptable options
Some options also accept a callback which is called at runtime and that takes the context as single argument, see here the details, which is representing contextual information and chart instance.
// creates a plugin options
AnnotationOptions options = new AnnotationOptions();
// creates an annotation
PointAnnotation point = new PointAnnotation();
// sets callback for border width options
point.setBorderWidth(new WidthCallback<AnnotationContext>(){

   @Override
   public Integer invoke(DatasetContext context){
      // logic
      return borderWidth;
   }
});
// stores the annotation in the main options
options.setAnnotations(point);
The following options can be set by a callback:
| Name | Callback | Returned types |
|---|---|---|
| adjustScaleRange | AdjustScaleRangeCallback | boolean |
| backgroundColor | ColorCallback<AnnotationContext> | String - IsColor - Pattern |
| borderColor | ColorCallback<AnnotationContext> | String - IsColor |
| borderDash | BorderDashCallback<AnnotationContext> | List<Integer> |
| borderDashOffset | BorderDashOffsetCallback<AnnotationContext> | double |
| borderWidth | WidthCallback<AnnotationContext> | int |
| display | DisplayCallback<AnnotationContext> | boolean |
| drawTime | DrawTimeCallback | DrawTime |
| radius | RadiusCallback<AnnotationContext> | double |
| xValue | ValueCallback | String - double - Date |
| yValue | ValueCallback | String - double - Date |
Events
All annotations provide a set of callbacks which can be enabled to catch events on them.
To catch events is enough to set the events which you want to catch at AnnotationOptions and set a callback instance in the annotation.
// creates a plugin options
AnnotationOptions options = new AnnotationOptions();
// creates an annotation
// without id (a unique one is created automatically)
BoxAnnotation box = new BoxAnnotation();
// sets callback
box.setClickCallback(new ClickCallback(){

    @Override
    public void onClick(IsChart chart, AbstractAnnotation annotation, ChartEventContext event){
        // logic
    }
});
These are the table of callbacks to implement:
| Event | Callback type | Description |
|---|---|---|
| enter | EnterCallback | Called when the mouse enters the annotation. |
| leave | LeaveCallback | Called when the mouse leaves the annotation. |
| click | ClickCallback | Called when a single click occurs on the annotation. |
| dblClick | DoubleClickCallback | Called when a double click occurs on the annotation. |
Scriptable context
Some options also accept a callback which is called at runtime and that takes the context as single argument, AnnotationContext representing contextual information and chart instance.
// creates a plugin options
AnnotationOptions options = new AnnotationOptions();
// creates an annotation
BoxAnnotation box = new BoxAnnotation();
// sets callback for border width options
box.setBorderWidth(new WidthCallback<AnnotationContext>(){

   @Override
   public Integer invoke(DatasetContext context){
      // logic
      return borderWidth;
   }
});
// stores the annotation in the main options
options.setAnnotations(box);
The context object contains the following properties:
| Name | Type | Description |
|---|---|---|
| annotation | AbstractAnnotation | The annotation configuration where the options is defined as scriptable. |
| attributes | NativeObjectContainer | User object which you can store your options at runtime. |
| chart | IsChart | Chart instance. |
| type | ContextType | The type of the context. It can be ContextType.CHART or ContextType.ANNOTATION |