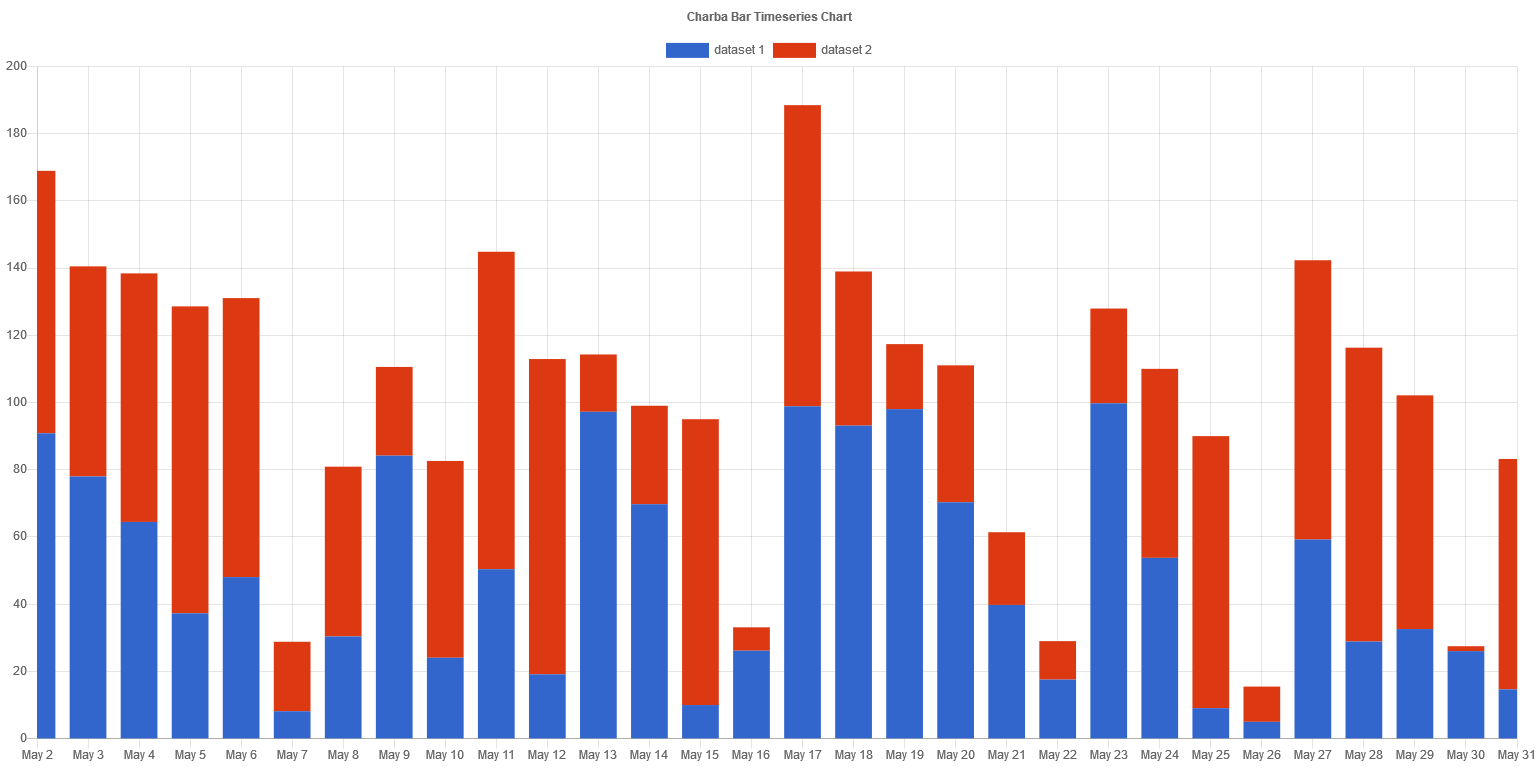
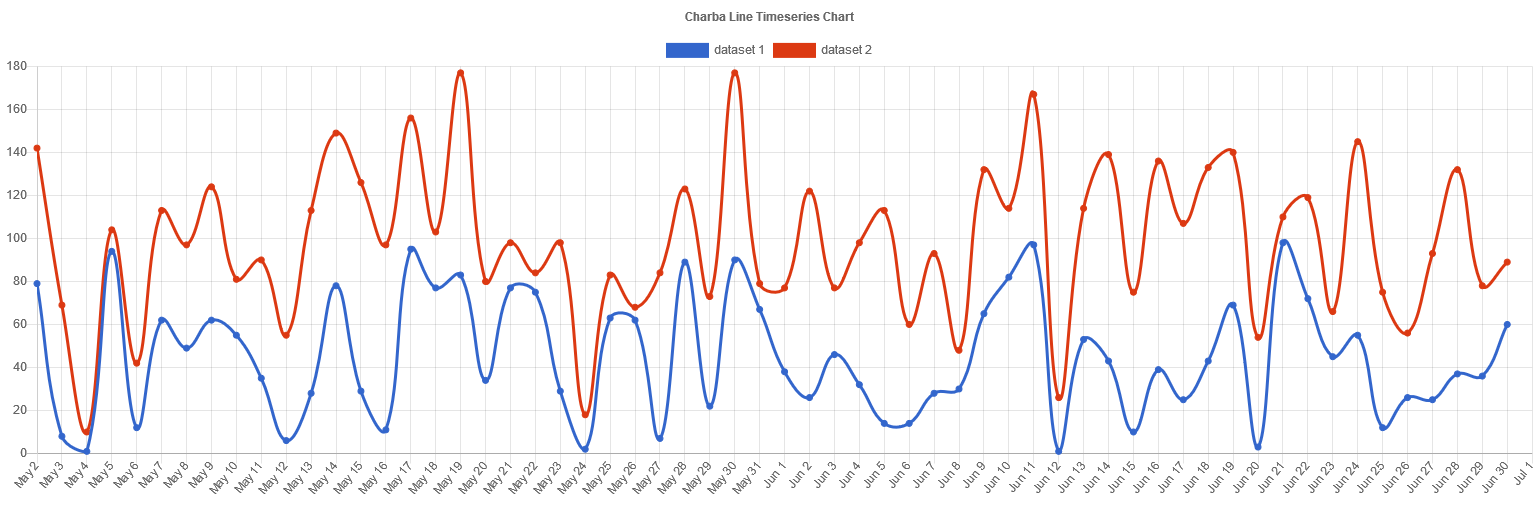
Time series charts
A time series chart is a data visualization tool that illustrates data points at successive intervals of time. Each point on the chart corresponds to both a time and a quantity that is being measured.
Time series charts present a series of data points collected over a specified reporting period. The x-axis plots time and the y-axis plots data points.

Charba provides 2 time series charts which are extending the line and bar charts implementation. These time series charts help the developer providing some methods and axes implementations.
A time series chart have already defined the axes to use (time series cartesian axis for X axes and linear cartesian axis for Y axis). The developer can access to the instances and just configure them without creating any axis instance.
Dataset
The time series charts allow a number of properties to be specified for each time series line or bar datasets which are implementing the same properties of line and bar ones.
See line dataset or bar dataset configuration how to configure the time series dataset, because no additional options are defined.
Every chart has got a method to create a typed dataset accordingly with the chart type. The dataset can be also created instantiating the constructor.
// creates a line time series chart
TimeSeriesLineChart chart = new TimeSeriesLineChart();
// for GWT
// TimeSeriesLineChartWidget chart = new TimeSeriesLineChartWidget();
// creates a dataset
TimeSeriesLineDataset dataset = chart.newDataset();
// sets the option
dataset.setBackgroundColor(HtmlColor.RED);
... // adds data and dataset configuration
// adds dataset to chart
chart.getData().setDatasets(dataset);
Data structure
The data of a dataset for a time series chart can be passed in two formats.
Data as doubles or as strings
Even if the methods to load data by these methods are not hidden, you can NOT use them to load data in a time series chart (not allowed and an exception will throw). See how to load data by time series items or data points.
Data as TimeSeriesItems
A time series item is a wrapper to the data points in order to simplify how to set data in a time series chart.
The chart instance will sort automatically the time series items by date in ascending mode (as required).
// creates a line time series chart
TimeSeriesLineChart chart = new TimeSeriesLineChart();
// for GWT
// TimeSeriesLineChartWidget chart = new TimeSeriesLineChartWidget();
// creates a dataset
TimeSeriesLineDataset dataset = chart.newDataset();
// creates an empty list to contain the items
List<TimeSeriesItem> data = new LinkedList<>();
// creates time series items and add to the list
data.add(new TimeSeriesItem(new Date(time1), number_value1));
data1.add(new TimeSeriesItem(new Date(time2), number_value2));
// sets the time series items as data to the dataset
dataset.setTimeSeriesData(data);
// adds dataset to chart
chart.getData().setDatasets(dataset);
Data as DataPoints
Each data point is specified using an object containing y and x (as time type) properties for time series.
// creates a line time series chart
TimeSeriesLineChart chart = new TimeSeriesLineChart();
// for GWT
// TimeSeriesLineChartWidget chart = new TimeSeriesLineChartWidget();
// creates a dataset
TimeSeriesLineDataset dataset = chart.newDataset();
// creates a datapoint
DataPoint dp1 = new DataPoint();
dp1.setY(number_value1);
dp1.setX(new Date(time1));
// creates a datapoint
DataPoint dp2 = new DataPoint();
dp2.setY(number_value1);
dp2.setX(new Date(time2));
// sets the data points as data to the dataset
dataset.setDataPoints(dp1, dp2);
// adds dataset to chart
chart.getData().setDatasets(dataset);
Options
The time series chart defines specific options implementation of line or bar to be configured.
See line chart or bar chart options how to configure the time series chart, because no additional options are defined.
// creates a line time series chart
TimeSeriesLineChart chart = new TimeSeriesLineChart();
// for GWT
// TimeSeriesLineChartWidget chart = new TimeSeriesLineChartWidget();
// gets options
TimeSeriesLineOptions options = chart.getOptions();
// sets options
options.setResponsive(true);

The time series options have already defined the out-of-the-box axes (time series cartesian axis for X axes and linear cartesian axis for Y axis) to use. The developer can access to the instances and just configure them without creating any axis instance.
// creates a line time series chart
TimeSeriesLineChart chart = new TimeSeriesLineChart();
// gets time series cartesian axis
CartesianTimeSeriesAxis timeseriesAxis = chart.getOptions().getScales().getTimeAxis();
// sets options
timeseriesAxis.getTime().setUnit(TimeUnit.DAY);
// gets linear cartesian axis
CartesianLinearAxis linearAxis = chart.getOptions().getScales().getLinearAxis();
// sets options
linearAxis.setBeginAtZero(true);
Segment
The time series line charts can contain a segment options element which can manage the styles of data sets in each own segment between the points and can override the data set configuration by scriptable options.
// creates a line time series chart
TimeSeriesLineChart chart = new TimeSeriesLineChart();
// sets segment callback for border color
chart.getOptions().getSegment().setBorderColor(new ColorCallback<SegmentContext>() {

    @Override
    public Object invoke(SegmentContext context) {
        // if value of point 1 greater than value of point 0
        // the border color will be "green", otherwise "gray"
        double valuePoint0 = context.getStartPoint().getParsed().getY();
        double valuePoint1 = context.getEndPoint().getParsed().getY();
        return valuePoint0 < valuePoint1 ? HtmlColor.GRAY : HtmlColor.GREEN;
    }
});
// sets segment callback for background color
chart.getOptions().getSegment().setBackgroundColor(new ColorCallback<SegmentContext>() {

    @Override
    public Object invoke(SegmentContext context) {
        // if value of point 1 greater than value of point 0
        // the background color will be "light green", otherwise "gray"
        double valuePoint0 = context.getStartPoint().getParsed().getY();
        double valuePoint1 = context.getEndPoint().getParsed().getY();
        return valuePoint0 < valuePoint1 ? HtmlColor.LIGHT_GRAY : HtmlColor.LIGHT_GREEN;
    }
});
Below an example how you have a time series line chart where each week is colored with different color:

Currently all of the border options and background color are supported. The segment styles are resolved for each section of the time series line between each point.
These are the options specific to line charts:
| Name | Callback | Returned types |
|---|---|---|
| backgroundColor | ColorCallback<SegmentContext> | String - IsColor - Pattern |
| borderCapStyle | CapStyleCallback<SegmentContext> | CapStyle |
| borderColor | ColorCallback<SegmentContext> | String - IsColor |
| borderDash | BorderDashCallback<SegmentContext> | List<Integer> |
| borderDashOffset | BorderDashOffsetCallback<SegmentContext> | double |
| borderJoinStyle | JoinStyleCallback<SegmentContext> | JoinStyle |
| borderWidth | WidthCallback<SegmentContext> | int |
The callbacks are getting the only 1 argument, the segment context which contains the context of the callback execution.
The context object contains the following properties:
| Name | Type | Description |
|---|---|---|
| attributes | NativeObjectContainer | User object which you can store your options at runtime. |
| chart | IsChart | Chart instance. |
| datasetIndex | int | The index of the dataset. |
| endDataIndex | int | The index of second point in the data. |
| endPoint | PointElement | The line element for the end point of the segment. |
| startDataIndex | int | The index of first point in the data. |
| startPoint | PointElement | The line element for the start point of the segment. |
| type | ContextType | The type of the context. It can be ONLY ContextType.SEGMENT. |