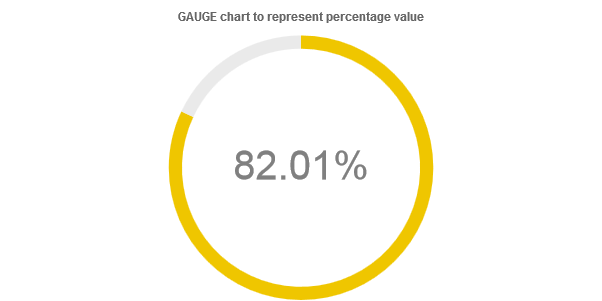
Gauge chart
A gauge chart is Charba extension of doughnut chart, by a controller implementation.
The gauge charts are divided in the segments, the arc of each segment shows the proportional value of data.
Programmatically, you could use a gauge chart as following:
// creates the chart
GaugeChart chart = new GaugeChart();
// adds to DOM
component.add(chart);
...
// example for Elemental2
// gets the chart instance as DOM element
Element element = chart.getChartElement().as();
// adds to DOM
DomGlobal.document.body.appendChild(element);
By UIBinder (ONLY for GWT), you could use a gauge chart as following:
<ui:UiBinder xmlns:ui="urn:ui:com.google.gwt.uibinder"
   xmlns:g="urn:import:com.google.gwt.user.client.ui"
   xmlns:c="urn:import:org.pepstock.charba.client.gwt.widgets">

   <g:HTMLPanel  width="100%">
      ....
      <c:GaugeChartWidget ui:field="chart"/>
      ...
   </g:HTMLPanel>
</ui:UiBinder>
Dataset
The gauge chart allows a number of properties to be specified for the gauge dataset.
// creates the chart
GaugeChart chart = new GaugeChart();
// creates the dataset
GaugeDataset dataset = chart.newDataset();
// sets the value
dataset.setValue(90.5D);
// sets thresholds
dataset.setThresholds(DefaultThreshold.NORMAL.getThreshold().setValue(40),
    DefaultThreshold.WARNING.getThreshold().setValue(75),
    DefaultThreshold.CRITICAL.getThreshold().setValue(100));
// sets the dataset to the chart
chart.getData().setDatasets(dataset);
See doughnut dataset configuration how to configure the gauge dataset, in addition of following options:
| Name | Type | Default | Description |
|---|---|---|---|
| emptyColor | String[] - IsColor[] | rgb(234,234,234) - | The color to fill the segment of the chart which represents the empty part. |
| percentageThreshold | boolean | true | If true, it uses the percentage as threshold instead of the value. |
| thresholds | Threshold[] | [] | The thresholds to apply to the gauge dataset. |
A gauge chart can have ONLY 1 dataset.
The dataset can be created instantiating the constructor, passing the maximum value of chart.
The default value of maximum value is 100.
// sets max value
int maxValue = 200;
// creates the chart
GaugeChart chart = new GaugeChart();
// creates the dataset with new max value
GaugeDataset dataset = chart.newDataset(maxValue);
// sets the value
dataset.setValue(90.5D);
// sets the dataset to the chart
chart.getData().setDatasets(dataset);
Using thresholds
The thresholdsis the entity which defines the color of the dataset, based on the value of the threshold.
A threshold is composed by 3 attributes:
- name, mandatory attribute to apply the name, for instance
"warning". - value, optional attribute to set the value, the default is
Double.MAX_VALUE. - color, optional attribute to set the color to use in the data set when the threshold is activated y the value of data set, the default is
rgb(140, 214, 16)- .
The below example is configuring the chart in order to use
- green color if the value of dataset is less or equals to 50,
- yellow color if the value of dataset is less or equals to 75 and greater than 50,
- red color if the value of dataset is greater than 75 (set to 100 because it's the maximum value of the data set).
Threshold myNorm = new Threshold("normal", 50, HtmlColor.GREEN);
Threshold myWarn = new Threshold("warning", 75, HtmlColor.YELLOW);
Threshold myCrit = new Threshold("critical", 100, HtmlColor.RED);
// creates the chart
GaugeChart chart = new GaugeChart();
// creates the dataset
GaugeDataset dataset = chart.newDataset();
// sets the thresholds
dataset.setThresholds(myNorm, myWarn, myCrit);
// sets the dataset to the chart
chart.getData().setDatasets(dataset);
Charba provides a default threshold implementation by gauge threshold enumeration.
| Threshold instance | Name | Value | Color |
|---|---|---|---|
| DefaultThreshold.NORMAL | "NORMAL" | 75 | rgb(140, 214, 16) - |
| DefaultThreshold.WARNING | "WARNING" | 90 | rgb(239, 198, 0) - |
| DefaultThreshold.CRITICAL | "CRITICAL" | Double.MAX_VALUE | rgb(231, 24, 49) - |
You can reuse the gauge threshold enumeration, changing color or value or both.
Threshold myNorm = DefaultThreshold.NORMAL.getThreshold().setValue(50).setColor(HtmlColor.GREEN);
Threshold myWarn = DefaultThreshold.WARNING.getThreshold().setValue(75).setColor(HtmlColor.YELLOW);
Threshold myCrit = DefaultThreshold.WARNING.getThreshold().setValue(100).setColor(HtmlColor.RED);
// creates the chart
GaugeChart chart = new GaugeChart();
// creates the dataset
GaugeDataset dataset = chart.newDataset();
// sets the thresholds
dataset.setThresholds(myNorm, myWarn, myCrit);
// sets the dataset to the chart
chart.getData().setDatasets(dataset);
Data structure
The data of a dataset for a gauge chart is specified as single value.
// creates the dataset
GaugeDataset dataset = chart.newDataset();
// sets the value
dataset.setValue(90.5D);
The setData methods are available, inherited by a doughnut dataset, but you can NOT use them otherwise an exception will throw.
Use setValue instead.
Options
The gauge chart defines the following configuration options. It extends the meter options.
To set the options at chart level, you can get a typed object accordingly with the chart type.
// creates the chart
GaugeChart chart = new GaugeChart();
// gets options
GaugeOptions options = chart.getOptions();
// sets options
options.setRender(Render.PERCENTAGE);
options.setPrecision(3);
See doughnut chart configuration how to configure the gauge chart, in addition of following options:
| Name | Type | Default | Description |
|---|---|---|---|
| animated | boolean | false | If the rendered label will be shown based on the animation of chart. |
| autoFontSize | boolean | true | If true, the font size to applied to the rendered label will be automatically calculated at runtime, otherwise will use the size property of the font. |
| cutoutPercentage | String | "90%" | Immutable property, always "90%". |
| circumference | double | 360 | Immutable property, always 360. |
| render | Render | Render.VALUE | Determines which information must be rendered in the meter chart. |
| font | IsFont | See description | Font of rendered label. If autoFontSize is set to true, the size property is ignored because automatically calculated at runtime.The default value is the global font. See Font. |
| fontColor | IsColor | rgb(128, 128, 128) - | Color of font color |
| precision | int | 2 | The amount to decimals digits to apply to the value. |
| rotation | double | 0 | Immutable property, always 0. |
The gauge chart disables the legend, tooltips and animation components.
Scriptable
Scriptable options in the configuration accept a callback which is called for each animation cycle.
There are 2 options which can be defined as scriptable:
fontColor, to set the color of the label.format, to set the value of the label.
The callbacks are getting the only 1 argument, the scriptable context which contains the context of the callback execution.
The context object contains the following properties:
| Name | Type | Description |
|---|---|---|
| attributes | NativeObjectContainer | User object which you can store your options at runtime. |
| chart | IsChart | Chart instance. |
| easing | double | The easing of drawing (between 0 and 1) for animation. |
| type | ContextType | The type of the context. It can be ONLY ContextType.METER. |
| value | double | The value of meter or gauge dataset. |
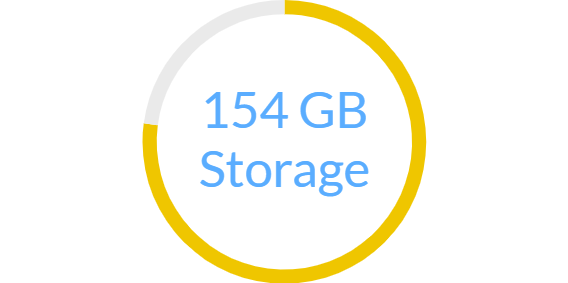
Formatting
In order to customize the value to show in the chart, you can implement a MeterFormatCallback, as following:
// creates the chart
GaugeChart chart = new GaugeChart();
// sets the callback
chart.getOptions().setFormatCallback(new MeterFormatCallback(){

   @Override
   public String invoke(MeterContext context){
      // logic
      return format;
   }
});
Font coloring
In order to customize the font color of the rendered label to show in the chart, you can implement a ColorCallback, as following:

// creates the chart
GaugeChart chart = new GaugeChart();
// sets the callback
chart.getOptions().setFontColor(new ColorCallback<MeterContext>(){

   @Override
   public IsColor invoke(MeterContext context){
      // logic
      return color;
   }
});