Why Charba
GWT Web toolkit doesn't have any out of the box charting library.
There are some open source charting libraries for GWT available to be used but with some constraints or unclear items:
- internet connection needed
- open source license not completely clear, sometimes with some obligations like to add specific labels
- old packages not longer maintained
Google Charts tools are powerful, simple to use, and free. Unfortunately if you see the terms of service in the support section, you can read that you can NOT use it in offline mode.
Can I use charts offline?

Your users' computers must have access to https://www.gstatic.com/charts/loader.js
in order to use the interactive features of Google Charts. This is because the
visualization libraries that your page requires are loaded dynamically before you
use them.
The code for loading the appropriate library is part of the included script, and
is called when you invoke the google.charts.load() method. Our terms of service do
not allow you to download the google.charts.load or google.visualization code to
use offline.

Can I download and host the chart code locally, or on an intranet?

Sorry; our terms of service do not allow you to download and save or host the
google.charts.load or google.visualization code.
However, if you don't need the interactivity of Google Charts, you can screenshot
the charts and use them as you wish.
Other open-source libraries which provide charts for GWT Web toolkit have got sentences like the following one (even if they are available under open-source license):
 If you like this software and intend to use it we'd appreciate you letting us
 know, and possibly adding a link or reference back to our site.
For all these reasons, Charba has been developed.
We spent time to evaluate some open-source charts javascript libraries and finally we landed on Chart.JS.
Why?
Because it's simple, clean and user-friendly. Perfect words to describe the Chart.JS library.
The Chart.JS library is an HTML5 based JavaScript library for creating animated, interactive and customizable charts and graphs. With Chart.JS, you can easily get to visualize your mixed chart types without hassle, creating responsive web pages by default.
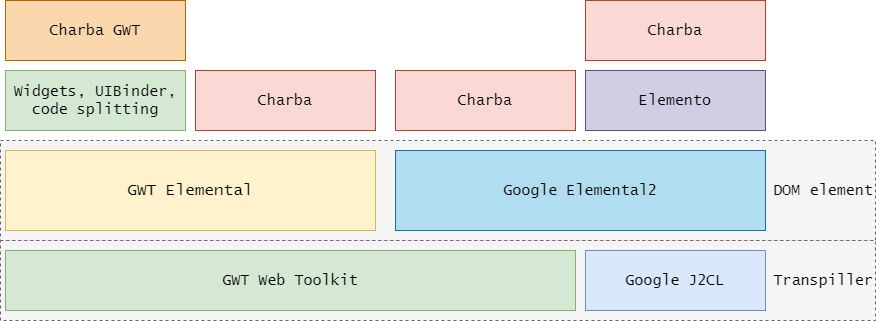
Even if Charba was born only as GWT library, as of version 3, Charba has been changed in order to be used not only in GWT but also with other DOM frameworks, base on J2CL - JavaToClosure, like Google Elemental2 or Elemento.
As of version 3, Charba has got an own DOM tree manager which allows to be independent from any other DOM tree manager (i.e. GWT, Elemental2 or Elemento) and it is providing a set of hooks in order to be use over those frameworks as well.
Features
Charba has implemented almost all Chart.JS features, as following:
- Default global options and scale, chart and scale options
- All charts types
- Line
- Bar (and horizontal Bar)
- Radar
- Polar area
- Doughnut
- Pie
- Bubble
- Scatter
- Area
- All options items
- Animation
- Layout
- Legend
- Title
- Tooltip
- Element
- Events
- All axes elements (with all configuration items for labelling and styling)
- Cartesian (linear, logarithmic, category, time, timeseries)
- Radial (linear)
- Charts API
- All plugins capabilities
- Date adapters capabilities
- Controller capabilities to extend existing chart by own chart types.
- Some Chart.JS plugins, provided as Charba extensions:
- Annotation which draws lines and boxes on the chart area.
- DataLabels which is a highly customizable plugin that displays labels on data for any type of charts.
- Gradient which is a light weight plugin to apply gradients to the datasets by data values.
- Labels which is a light weight plugin to display labels on pie, doughnut and polar area chart. Original PieceLabel.
- Zoom which enables zooming and panning on chart.
- Some Chart.JS controllers, provided as Charba extensions:
- Chart.js Geo which enables charting maps with legends, adding new chart types, choropleth and bubbleMap.
- Chart.js Treemap which enables treemap charts.
- Chart.js Matrix which enables matrix charts.
- Chart.js Sankey which enables a type of flow diagram in which the width of the arrows is proportional to the flow rate.
Out-of-the-box
Charba has implemented some out-of-the-box features, leveraging on Chart.JS features, mentioned above:
- Charts (by controllers)
- Meter
- Gauge
- Tiles builder to create patterns
- Plugins
- Chart background color
- Chart cursor pointer to change cursor hovering chart elements
- Chart dataset items selector (for drill down and zooming)
- Color schemes which enables to pick the color combination for charts from the predefined or custom schemes
- HTML legend to create own legend changing styles and multiple lines
- Crosshair to show a crosshair and relative axes values on the chart.
- Callbacks
- Tick callback to define the amount of decimals digits of the axis number values when all datasets are hidden
- Legend callback to avoid to hide all datasets
- Datalabels listeners callback to change cursor hovering the labels
- Datalabels listeners callback to select the labels, leveraging on DatasetSelectionEventHandler
- Datalabels formatter callback to return the percentage as value to show in the chart