Coloring
The colors on charts is very important because can make the difference to have an understandable result or not.
Usually the colors are managed as string, following the syntax defined for CSS, but sometimes this is annoying because its' easier to have the name of the color.
Charba provides:
- IsColor interface to manage colors
- Color entity to create and manage colors
- 3 enumerations with
- all color names defined for HTML, by enumeration HtmlColor
- all color names defined for GWT Material, by enumeration GwtMaterialColor
- first 31 color names defined for Google Charts, by enumeration GoogleChartColor
- all gradients defined by UiGradients.com, by enumeration UiGradient
Charba is using IsColor and colors as string in the methods where you must define a color.
Building colors
Even if the usual method is to use strings which are representing colors, leveraging on colors structure of Charba, you can use color as objects, defining your base colors and play with transparency without creating a specific string every time.
The IsColor interface (and then all colors defined out of the box) has got a method which returns a another color instance, based from source one, as following:
// it can be a static reference
Color myColor = new Color(255,0,0);
// new color based on previous one, which is immutable.
IsColor myColorWithAlpha = myColor.alpha(0.2D);
// new Color darker from the previous one
IsColor myDarkerColor = myColor.darker();
Another interesting utility is the ColorBuilder which can create IsColor instances by a string.
// parses color and creates new color.
// by HEX representation
IsColor myColorHex = ColorBuilder.parse("#FF0000");
// by RGB representation
IsColor myColorRGB = ColorBuilder.parse("rgb(255, 0, 0)");
// by RGBA representation
IsColor myColorRGBA = ColorBuilder.parse("rgba(255, 0, 0, 0.5)");
// by HSL representation
IsColor myColorHSL = ColorBuilder.parse("hsl(100, 100%, 50%)");
// by HSLA representation
IsColor myColorHSLA = ColorBuilder.parse("hsla(100, 100%, 50%, 0.5)");
// by color names representation
IsColor myColorName = ColorBuilder.parse("red");
The parser of ColorBuilder is able to parse color string representation by HEX, RGB, RGBA, HSL and HSLA.
The parser can also use HTML color names, defined in the HtmlColor enumeration.
Default color palette
If you don't have any preference for colors, you can use Chart.JS palette of seven brand colors:

To use the to Chart.JS palette, you sould set autoColors option to true, as following:
// --------------------------------------
// GLOBAL, for all charts (whatever type)
// --------------------------------------
Defaults.get().getGlobal().setAutoColors(true);

// --------------------------------------
// for specific chart instance
// --------------------------------------
chart.getOptions().setAutoColors(true);
By default the auto colors option only works when you initialize the chart without any colors for the border or background specified.
If you want to force the auto colors to always color your datasets, for example when using dynamic datasets at runtime you will need to set the autoColorsForceOverride option to true:
// --------------------------------------
// GLOBAL, for all charts (whatever type)
// --------------------------------------
Defaults.get().getGlobal().setAutoColorsForceOverride(true);

// --------------------------------------
// for specific chart instance
// --------------------------------------
chart.getOptions().setAutoColorsForceOverride(true);
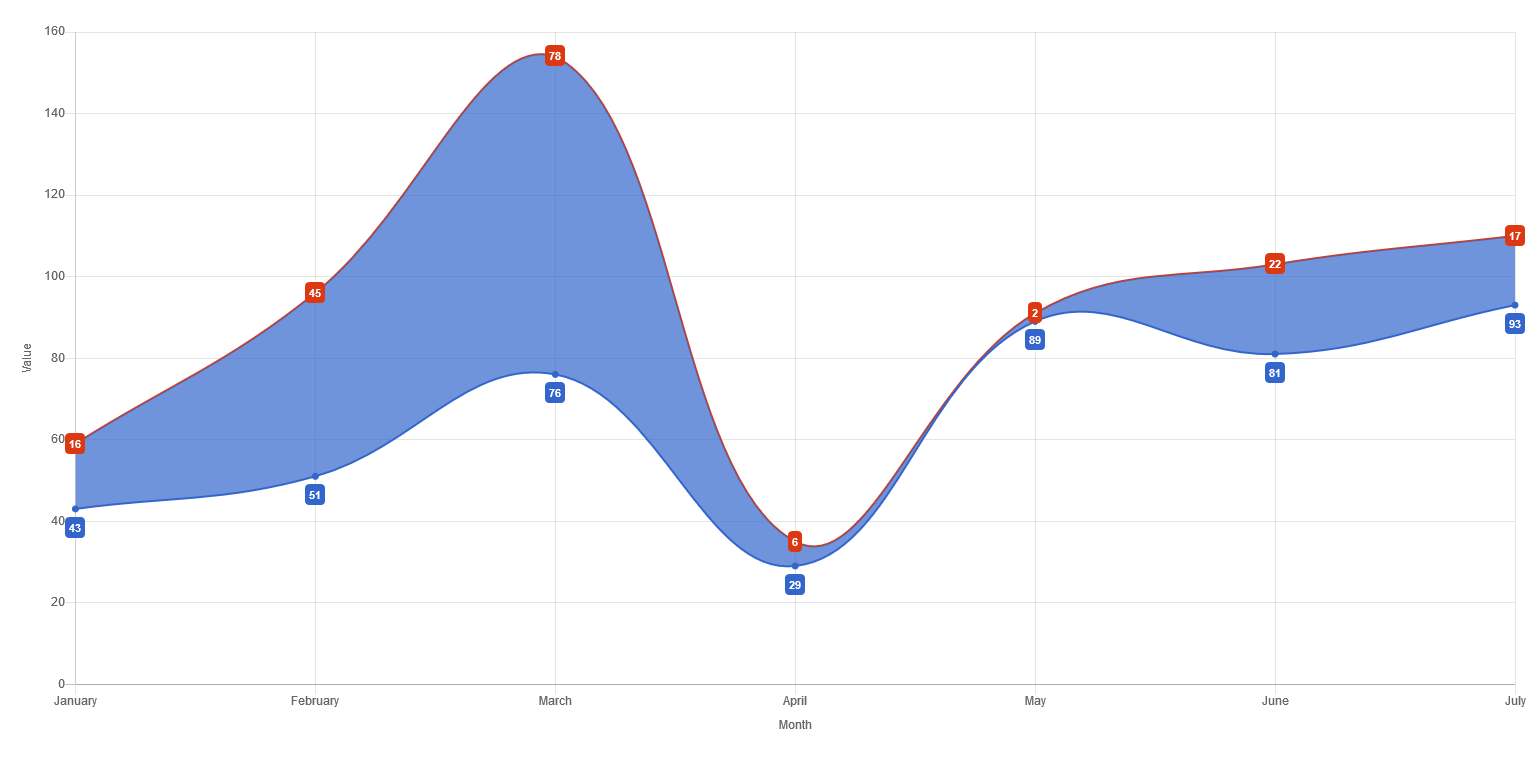
Filling
Both line and radar charts support a fill option on the dataset object which can be used to create area between two datasets or a dataset and a boundary.
Modes
Charba is providing an enumeration for fixed filling modes.
On top of these, you can set other kind of filling mode, as following:
| Mode | Type | Values |
|---|---|---|
| Absolute dataset index | int | 1, 2, 3, ... |
| Relative dataset index | String | "-1", "-2", "+1", ... |
To get absolute dataset index, you can get it by Fill.getFill(int) and you get a IsFill mode that you can set to Charba configuration.
To get relative dataset index, you can get it by Fill.getFill(String) and you get a IsFill mode that you can set to Charba configuration.
Furthermore Charba configuration enables the possibility to set directly absolute or relative filling mode, by setFill(int) or setFill(String) methods.
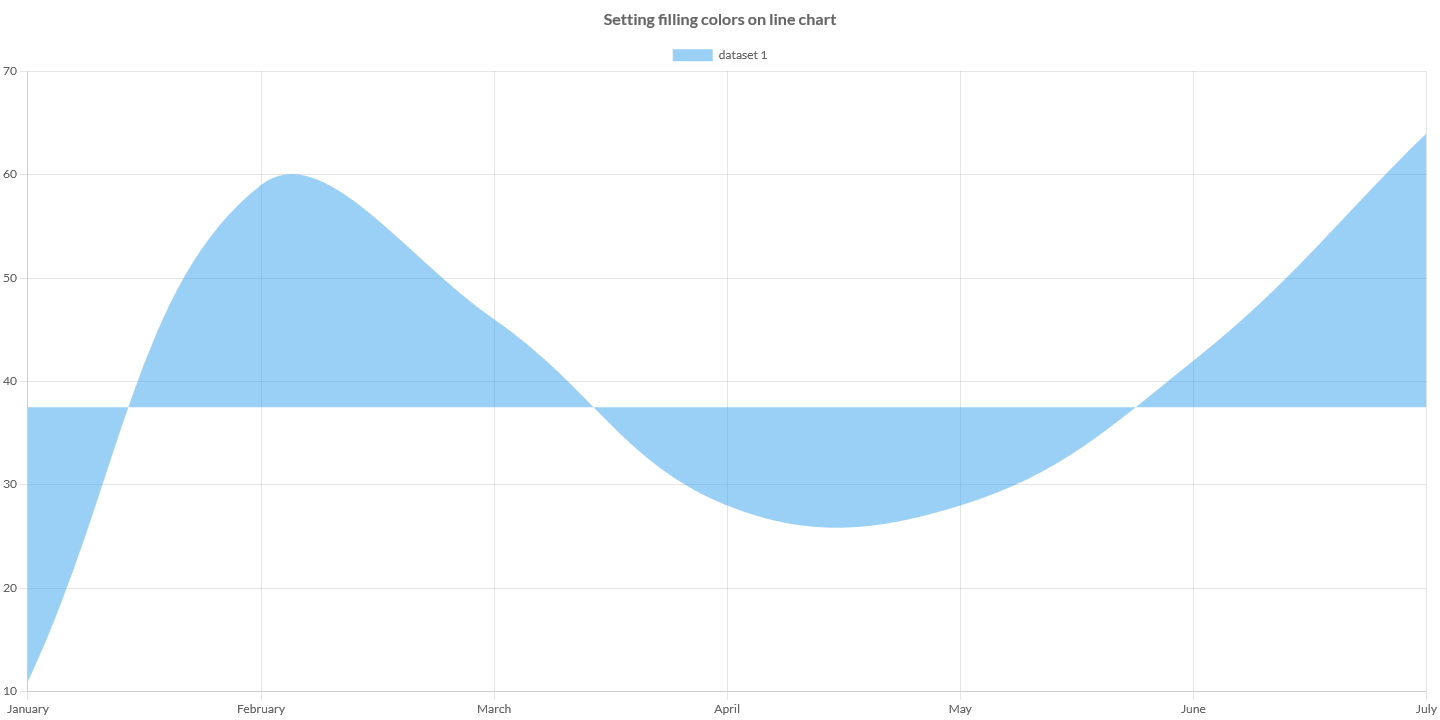
Baseline
By default, the filling of the datasets uses value equals to 0 of value axis to color the dataset above or below the line.
You can set a different value, setting the fill options with the axis value you want to use, using a number or a FillBaseline instance.
```java
// creates the chart
LineChart chart = new LineChart();
// creates the dataset
LineDataset dataset = chart.newDataset();
// sets the filling baseline option by a number
// which is the value of value axis
dataset.setFillBaseline(20);
...
// creates the dataset
LineDataset datasetNew = new LineDataset();
// sets the filling baseline option by a object
// which is the value of value axis
datasetNew.setFillBaseline(new FillBaseline(20));
...
// sets the datasets to the chart
chart.getData().setDatasets(dataset, datasetNew);
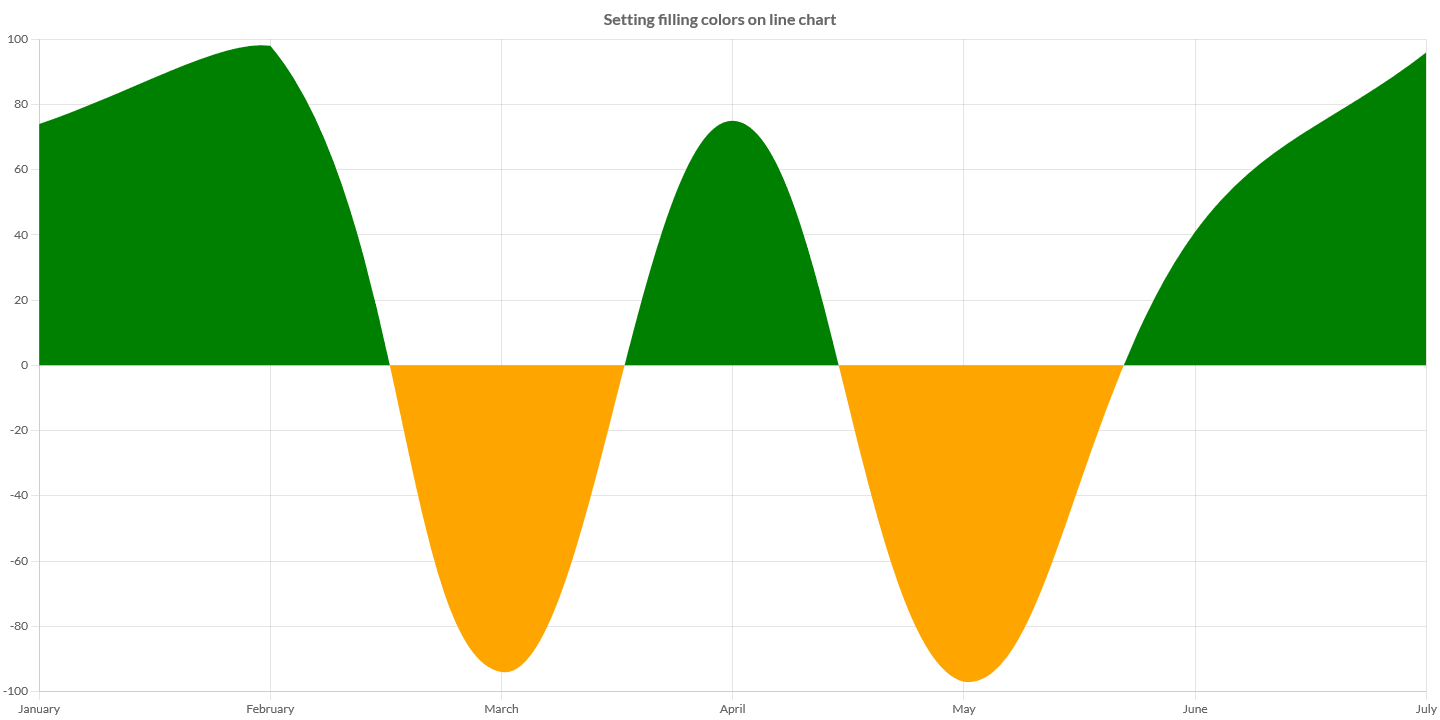
Different colors base on baseline
You can decide to have different filling colors above and below the baseline.
You can set a different colors, setting the fill options with the your colors you want to use, using a FillColors instance.
```java
// creates the chart
LineChart chart = new LineChart();
// creates the dataset
LineDataset dataset = chart.newDataset();
// creates a fill colors instance
FillColors colors = new FillColors();
colors.setFill(Fill.ORIGIN);
colors.setAboveColor(HtmlColor.GREEN);
colors.setBelowColor(HtmlColor.ORANGE);
// sets the filling colors option
dataset.setFillColors(colors);
...
...
// sets the dataset to the chart
chart.getData().setDatasets(dataset);