Regressions
(quoted from Regression analysis definition in Wikipedia)
Regression analysis is a set of statistical processes for estimating the relationships between a dependent variable (often called the 'outcome' or 'response' variable) and one or more independent variables (often called 'predictors', 'covariates', 'explanatory variables' or 'features').
The most common form of regression analysis is linear regression, in which one finds the line (or a more complex linear combination) that most closely fits the data according to a specific mathematical criterion.
Regression analysis is primarily used for two conceptually distinct purposes.
- regression analysis is widely used for prediction and forecasting, where its use has substantial overlap with the field of machine learning.
- in some situations regression analysis can be used to infer causal relationships between the independent and dependent variables. Importantly, regressions by themselves only reveal relationships between a dependent variable and a collection of independent variables in a fixed dataset. To use regressions for prediction or to infer causal relationships, respectively, a researcher must carefully justify why existing relationships have predictive power for a new context or why a relationship between two variables has a causal interpretation. The latter is especially important when researchers hope to estimate causal relationships using observational data.
Charba provides out of the box the feature to enable regressions leveraging on ML regression library.
Charba provides the following regressions models:
- Simple linear regression.
- Power regression.
- Exponential regression.
- Polynomial regression.
- Robust polynomial regression.
- TheilSen regression.
The regressions feature is native javascript implementation and Charba provides the wrapper in order to be able to use it.
The regression utility can be used even if the Charba.enable or DeferredCharba.enable are not called because it doesn't depend on CHART.JS.
Prediction
All regression instances can predict Y values by a single or a list of X values:
// creates samples
List<Double> x = Arrays.asList(0.5D, 1D, 1.5D, 2D, 2.5D);
List<Double> y = Arrays.asList(0D, 1D, 2D, 3D, 4D);
// creates regression
LinearRegression regression = RegressionBuilder.create(x, y).buildLinearRegression();
// predicts the Y value with x = 3
Console.log(regression.predict(3)); // emit "5"
Formula
All regression instances can show the formula which represents the regression model:
// creates samples
List<Double> x = Arrays.asList(0.5D, 1D, 1.5D, 2D, 2.5D);
List<Double> y = Arrays.asList(0D, 1D, 2D, 3D, 4D);
// creates regression
LinearRegression regression = RegressionBuilder.create(x, y).buildLinearRegression();
// shows formula
Console.log(regression.toFormula()); // emit "f(x) = 2 * x - 1"
// shows formula, with precision
Console.log(regression.toFormula(3)); // emit "f(x) = 2.00 * x - 1.00"
Score
The regression score provides the estimation and inference in the regressions. It can provide some methods which differ in computational simplicity of algorithms, presence of a closed-form solution, robustness with respect to heavy-tailed distributions, and theoretical assumptions needed to validate desirable statistical properties such as consistency and asymptotic efficiency.
The regression score provides:
- R (R), which is the proportion of variation in the outcome that is explained by the predictor variables. In multiple regression models, R corresponds to the correlation between the observed outcome values and the predicted values by the model. The higher the R, the better the model
- R-squared (R2), which is the proportion of variation in the outcome that is explained by the predictor variables. In multiple regression models, R2 corresponds to the squared correlation between the observed outcome values and the predicted values by the model. The Higher the R-squared, the better the model
- Pearson's chi-squared (Chi2), which is the sum of differences between observed and expected outcome frequencies (that is, counts of observations), each squared and divided by the expectation
- Root Mean Squared Error (RMSD), which measures the average error performed by the model in predicting the outcome for an observation. Mathematically, the RMSE is the square root of the mean squared error (MSE), which is the average squared difference between the observed actual outcome values and the values predicted by the model
// creates samples
List<Double> x = Arrays.asList(0.5D, 1D, 1.5D, 2D, 2.5D);
List<Double> y = Arrays.asList(0D, 1D, 2D, 3D, 4D);
// creates regression
LinearRegression regression = RegressionBuilder.create(x, y).buildLinearRegression();
// calculates the score
RegressionScore score = regression.score(x, y);
// shows R
Console.log(score.getR()); // emit 1
// shows R2
Console.log(score.getR2()); // emit 1
// shows Chi2
Console.log(score.getChi2()); // emit 0
// shows Rmsd
Console.log(score.getRmsd()); // emit 0
Using regressions on charts
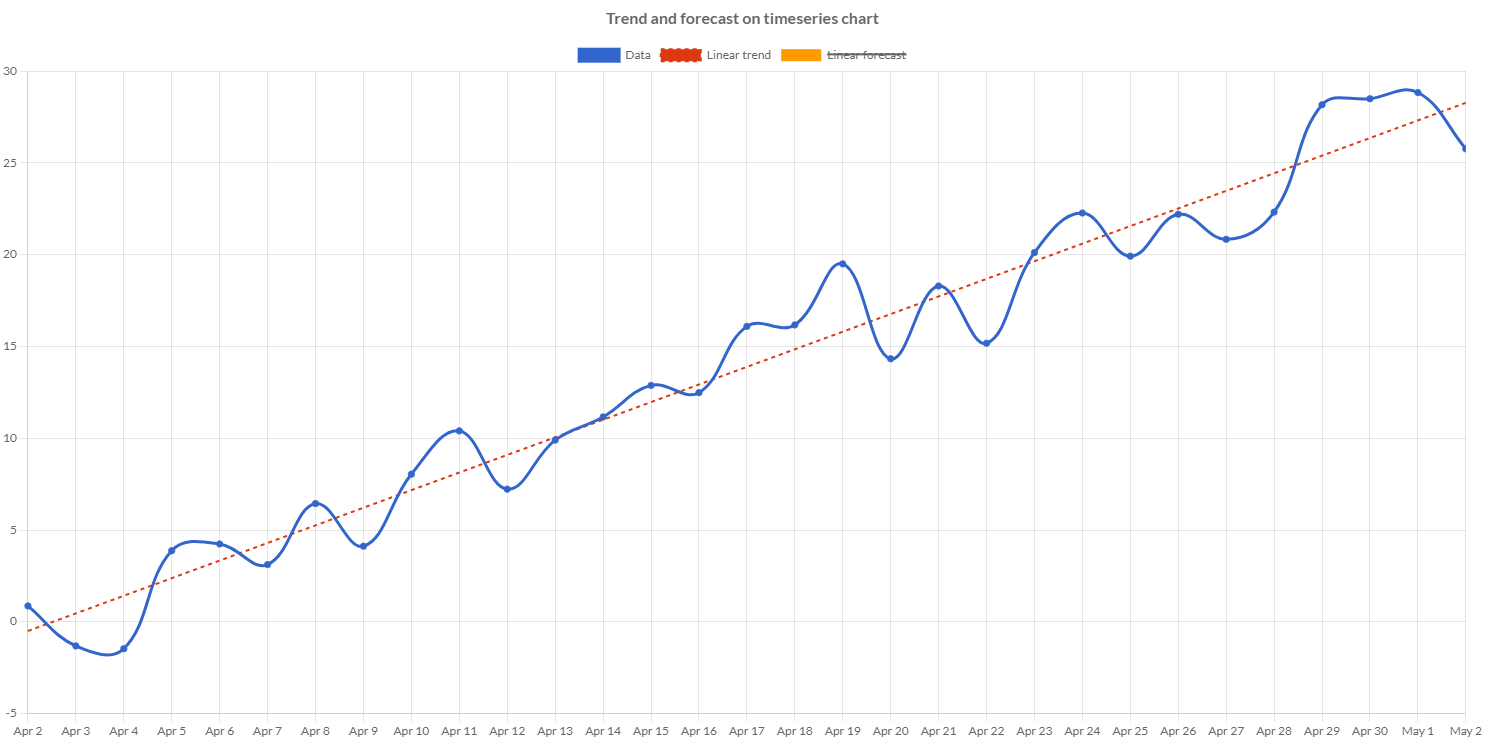
The provided regression instances can be used separately from charts or can be used in order to add to the chart a specific dataset with the predicted data.
To create a specific regression dataset, which is an extended line dataset, Charba provides a specific builder in order to create the dataset which is created implementing a regression.
// creates chart
LineChart chart = new LineChart();
// creates data set for chart
LineDataset dataset = chart.newDataset();
// data points list instance
List<DataPoint> dataPoints = new LinkedList<>();
// loads data points
...
// sets the data points to chart dataset
dataset.setDataPoints(dataPoints);

// creates a regression dataset
// using a list of samples by data points
// and creating a linear regression
// and loads the samples as data of dataset
RegressionDataset trend = RegressionDatasetBuilder.create()
    .setSamplesByDataPoints(dataPoints)
    .buildLinearRegression();
// sets label
trend.setLabel("Linear trend");
// sets dataset options
...
// adds datasets to chart
chart.getData().setDatasets(dataset, trend);
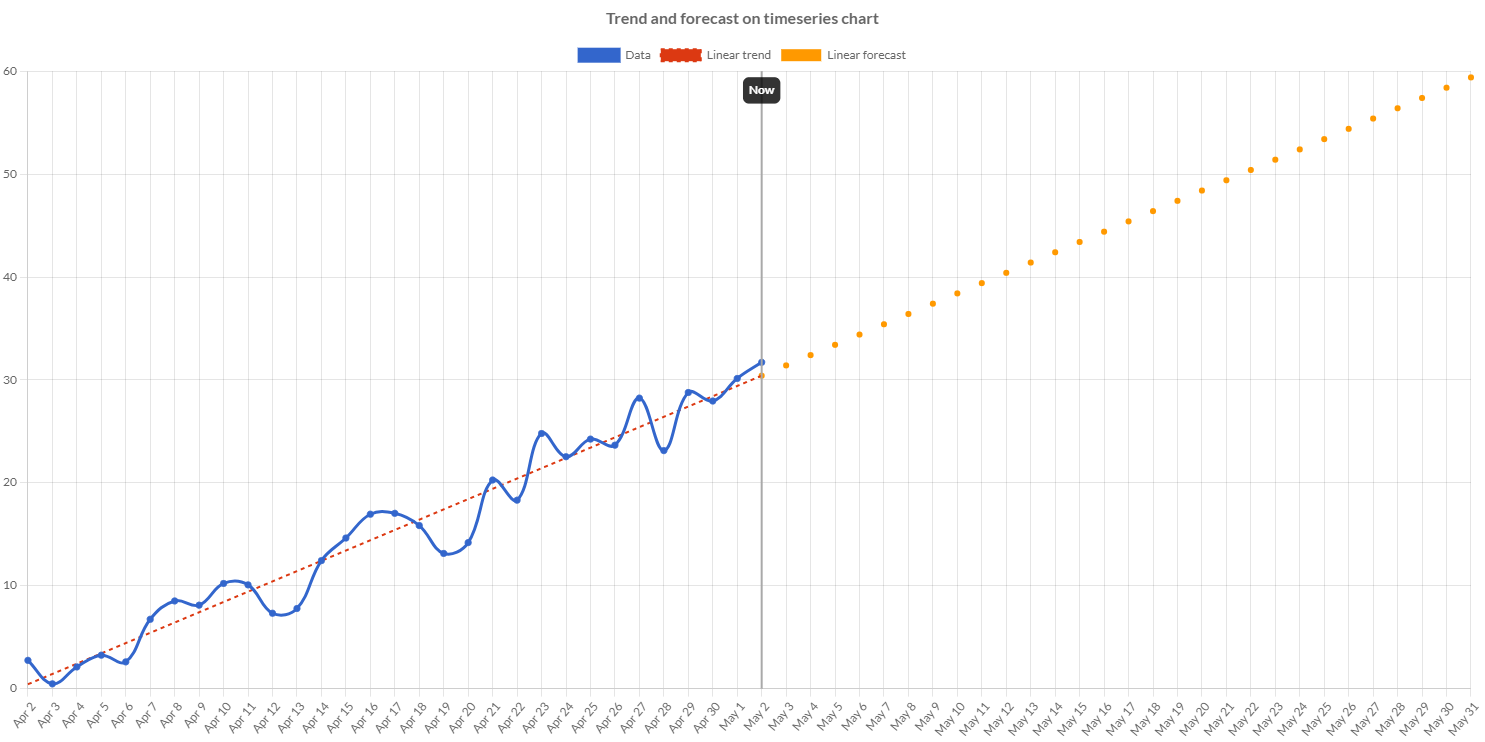
A regression regression dataset can also be used to add a forecast line to show in the chart.
// creates chart
LineChart chart = new LineChart();
// creates data set for chart
LineDataset dataset = chart.newDataset();
// data points list instance
List<DataPoint> dataPoints = new LinkedList<>();
// loads data points
...
// sets the data points to chart dataset
dataset.setDataPoints(dataPoints);

// creates a regression dataset
// using a list of samples by data points
// and creating a linear regression
// and loads the samples as data of dataset
RegressionDataset trend = RegressionDatasetBuilder.create()
    .setSamplesByDataPoints(dataPoints)
    .buildLinearRegression();
// sets label
trend.setLabel("Linear trend");
// sets dataset options
...
// creates the forecast dataset
// cloning an existing regression dataset set
// and leveraging on already calculated regression
RegressionDataset forecast = RegressionDatasetBuilder.build(trend);
// predicts the values adding a list of dates
// which are representing the X values
forecast.addXDates(forecastDates);
// sets label
forecast.setLabel("Linear forecast");
// sets dataset options
...
// adds datasets to chart
chart.getData().setDatasets(dataset, trend, forecast);
Simple linear
(quoted from Simple linear regression definition in Wikipedia)
Simple linear regression is a linear regression model with a single explanatory variable. That is, it concerns two-dimensional sample points with one independent variable and one dependent variable (conventionally, the x and y coordinates in a Cartesian coordinate system) and finds a linear function (a non-vertical straight line) that, as accurately as possible, predicts the dependent variable values as a function of the independent variable. The adjective simple refers to the fact that the outcome variable is related to a single predictor.
It is common to make the additional stipulation that the ordinary least squares (OLS) method should be used: the accuracy of each predicted value is measured by its squared residual (vertical distance between the point of the data set and the fitted line), and the goal is to make the sum of these squared deviations as small as possible.
The simple linear regression model can be represented using the below equation:
y = a0 + a1x
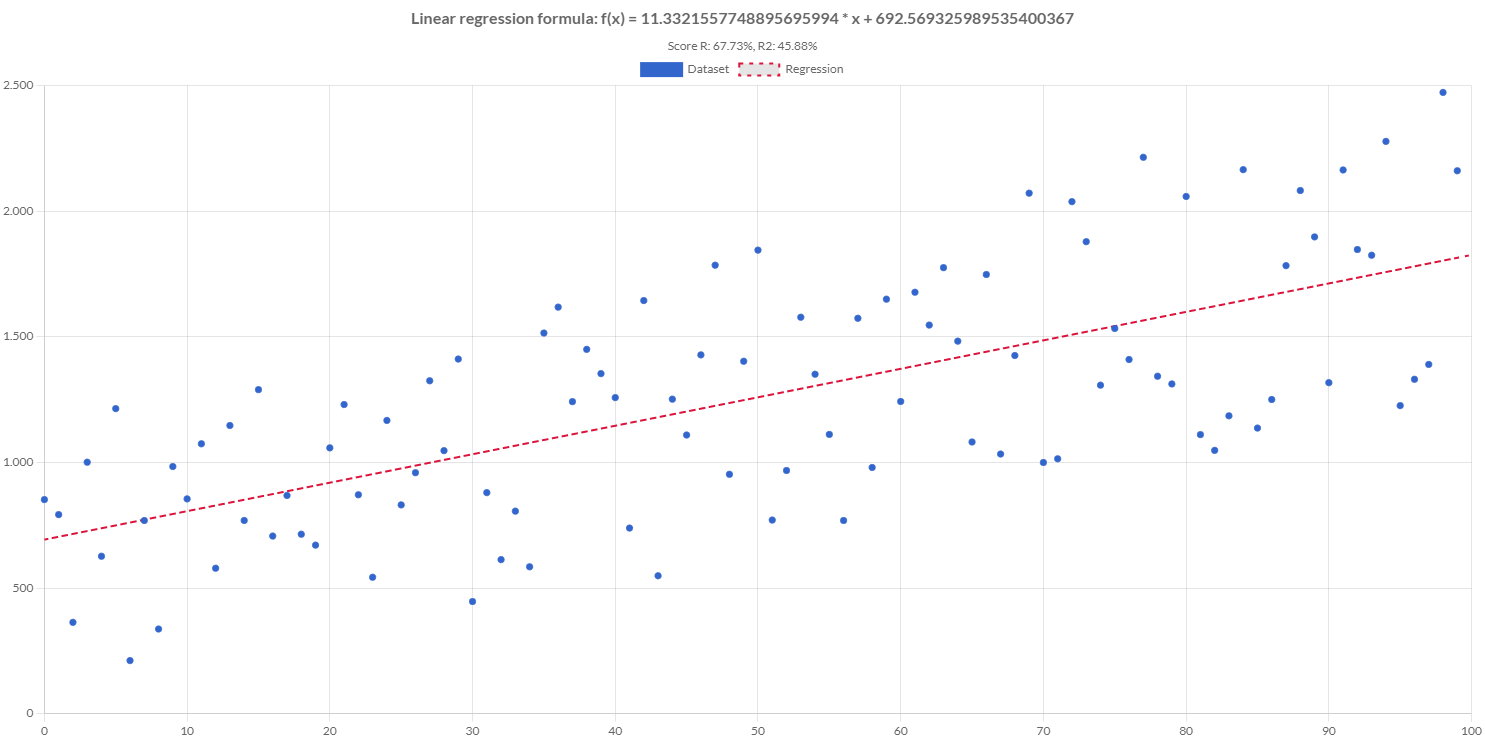
Creating a linear regression
Charba provides a builder to create a simple linear regression, passing the samples, in order to enable the use to predict values.
// creates samples
List<Double> x = Arrays.asList(0.5D, 1D, 1.5D, 2D, 2.5D);
List<Double> y = Arrays.asList(0D, 1D, 2D, 3D, 4D);
// creates regression
LinearRegression regression = RegressionBuilder.create(x, y).buildLinearRegression();
// coefficients
Console.log(regression.getSlope()); // emit 2
Console.log(regression.getIntercept()); // emit -1
Console.log(regression.getCoefficients().toString()); // emit [-1, 2]
// predicts the Y value with x = 3
Console.log(regression.predict(3)); // emit 5
// computes the X value with Y = 3.5
Console.log(regression.computeX(3.5)); // emit 2.25
Power
Power regression is a generalized linear model form of regression analysis used to model count data and contingency tables. It assumes the logarithm of its expected value can be modeled by a linear combination of unknown parameters.
Power regression is a non-linear regression technique that looks like this:
y = A * xB
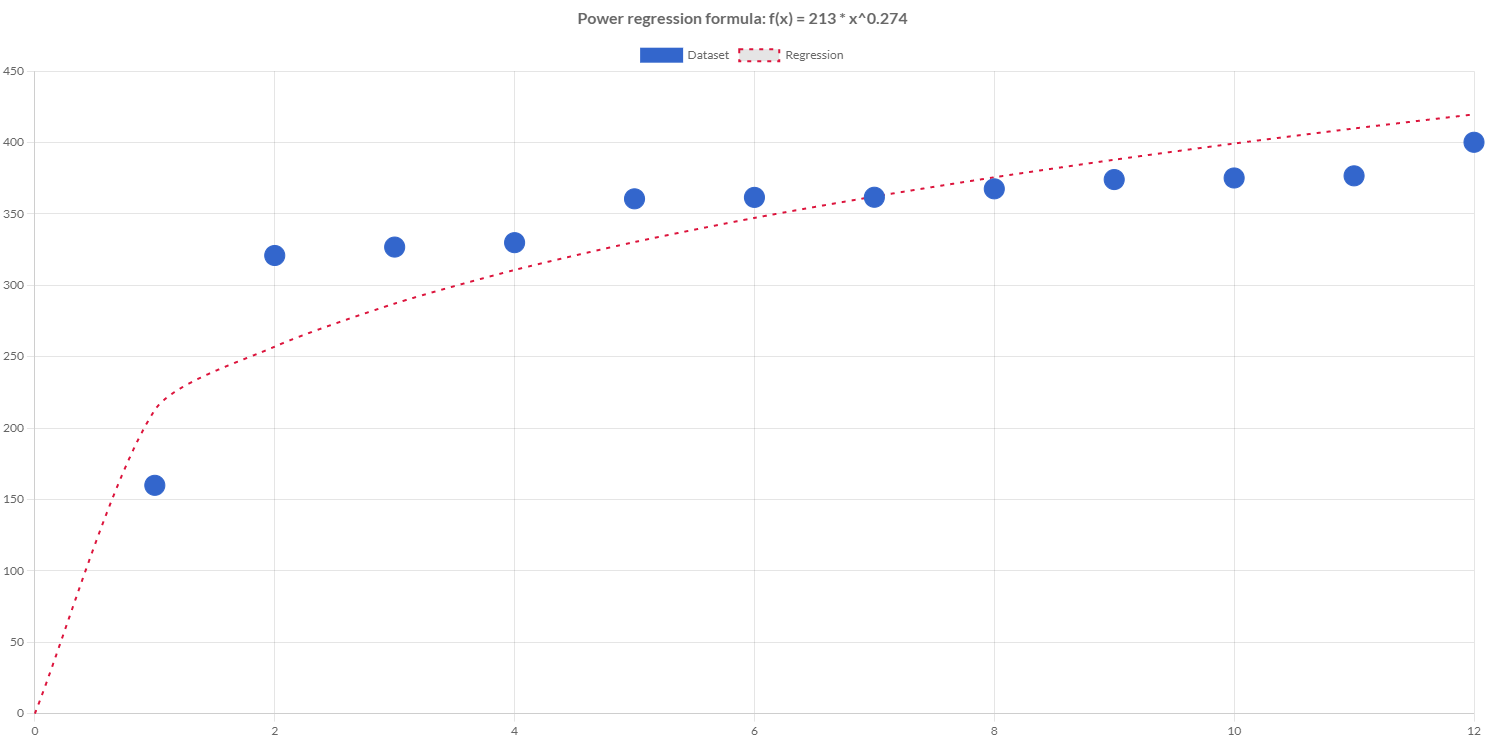
Creating a power regression
Charba provides a builder to create a power regression, passing the samples, in order to enable the use to predict values.
// creates samples
List<Double> x = Arrays.asList(1D, 2D, 3D, 4D, 5D, 6D, 7D, 8D, 9D, 10D, 11D, 12D);
List<Double> y = Arrays.asList(159.9, 320.9, 326.8, 329.9, 360.6, 361.6, 361.7, 367.6, 374.1, 375.2, 376.7, 400.2);
// creates regression
PowerRegression regression = RegressionBuilder.create(x, y).buildPowerRegression();
// coefficients
// coefficients
Console.log(regression.getA()); // emit 212.63671484070557
Console.log(regression.getB()); // emit 0.2736903998810649
// predicts the Y value with x = 2
Console.log(regression.predict(2)); // emit 257.0557209615831
Exponential
Exponential regression is a generalized linear model form of regression analysis used to model count data and contingency tables. It assumes the logarithm of its expected value can be modeled by a linear combination of unknown parameters.
Exponential regression is a non-linear regression technique that looks like this:
y = A * eB * x
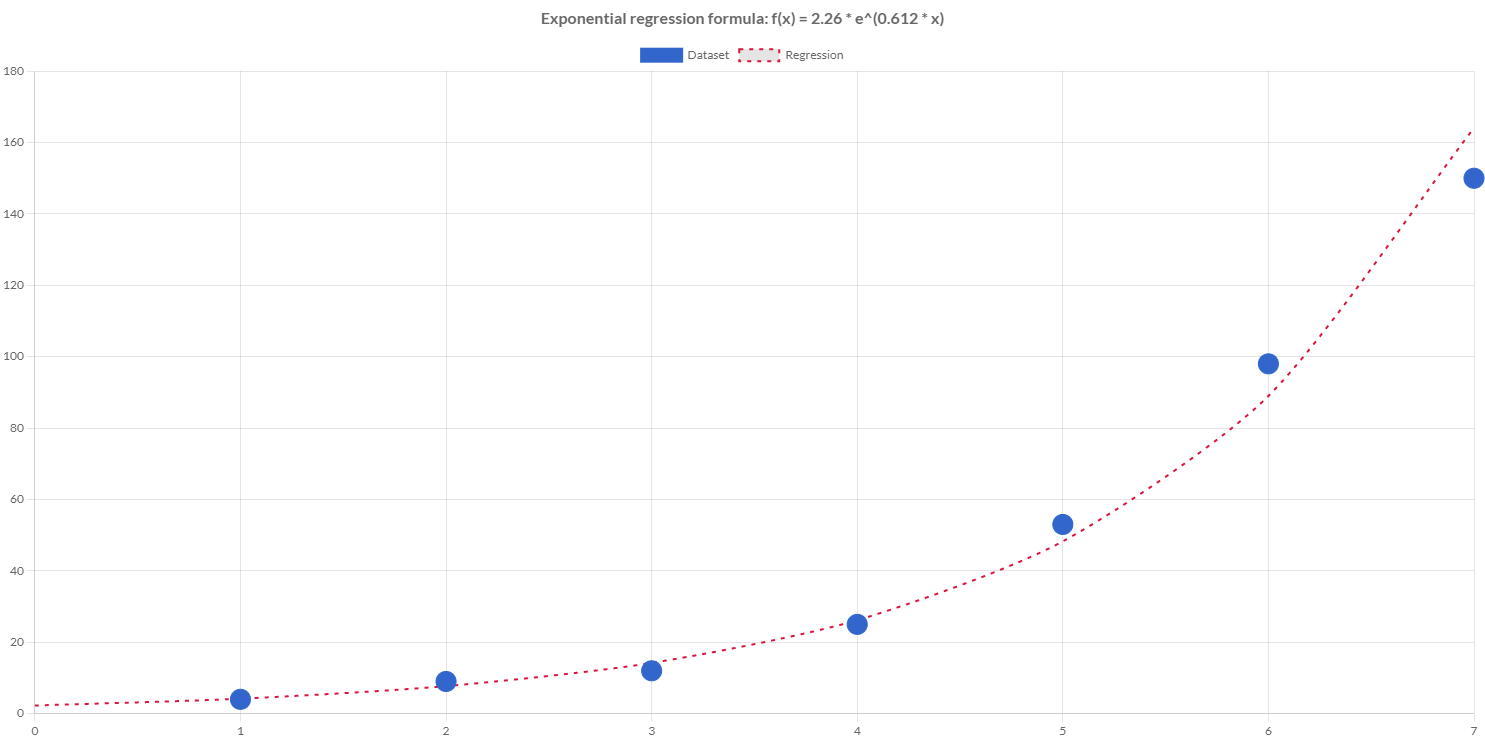
Creating an exponential regression
Charba provides a builder to create an exponential regression, passing the samples, in order to enable the use to predict values.
// creates samples
List<Double> x = Arrays.asList(0D, 1D, 2D, 3D, 4D);
List<Double> y = Arrays.asList(1.5D, 2.5D, 3.5D, 5D, 7.5D);
// creates regression
ExponentialRegression regression = RegressionBuilder.create(x, y).buildExponentialRegression();
// coefficients
Console.log(regression.getA()); // emit 0.391202
Console.log(regression.getB()); // emit 1.579909
// predicts the Y value with x = 2
Console.log(regression.predict(2)); // emit 3.454825
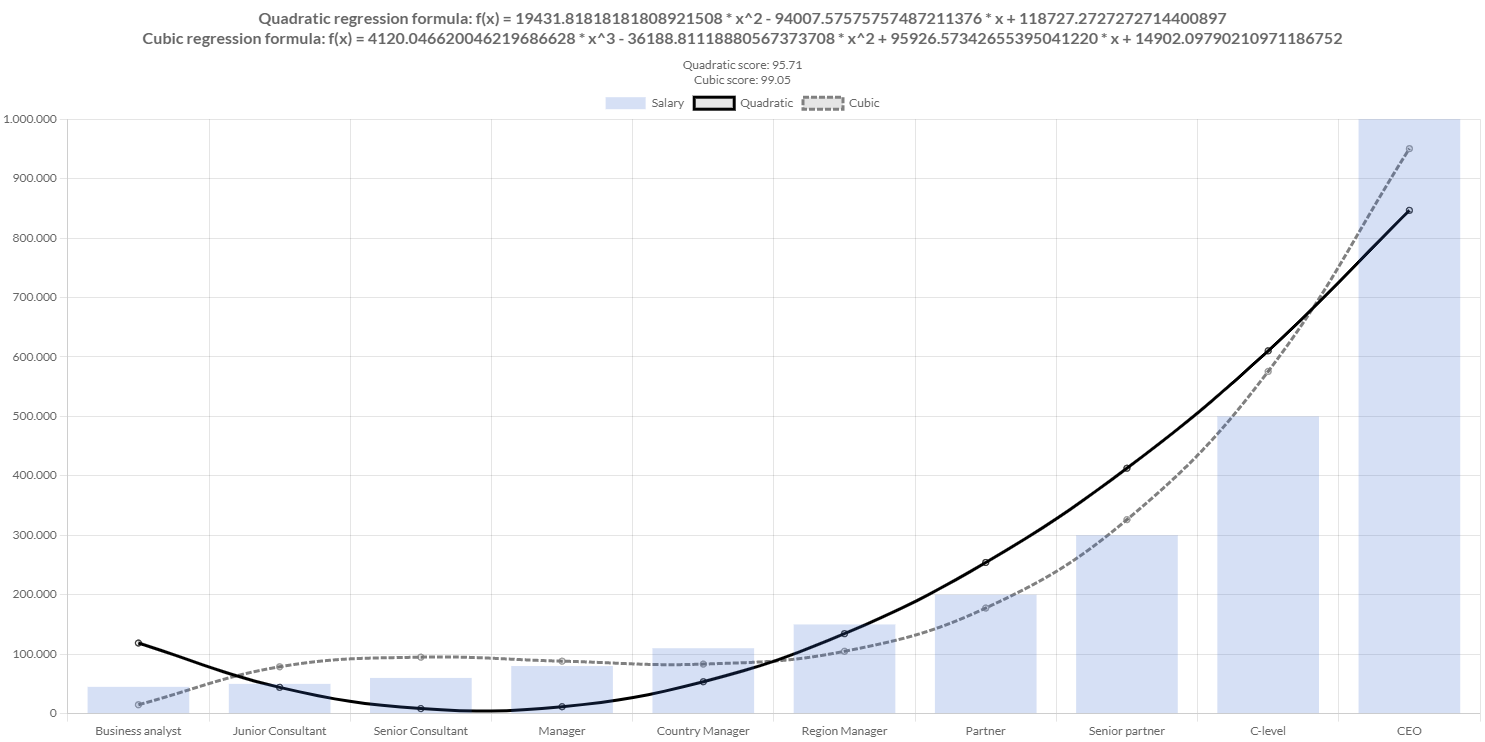
Polynomial
(quoted from Polynomial regression definition in Wikipedia)
Polynomial regression is a form of regression analysis in which the relationship between the independent variable x and the dependent variable y is modelled as an nth degree polynomial in x.
Polynomial regression fits a nonlinear relationship between the value of x and the corresponding conditional mean of y. Although polynomial regression fits a nonlinear model to the data, as a statistical estimation problem it is linear, in the sense that the regression function is linear in the unknown parameters that are estimated from the data. For this reason, polynomial regression is considered to be a special case of multiple linear regression.
The polynomial regression model can be represented using the below equation:
y = b0 + b1x1 + b2x12 + * b2x13 +...... bnx1n
Creating a polynomial regression
Charba provides a builder to create a polynomial regression, passing the samples, in order to enable the use to predict values.
// creates samples
List<Double> x = Arrays.asList(50D, 50D, 50D, 70D, 70D, 70D, 80D, 80D, 80D, 90D, 90D, 90D, 100D, 100D, 100D);
List<Double> y = Arrays.asList(3.3, 2.8, 2.9, 2.3, 2.6, 2.1, 2.5, 2.9, 2.4, 3.0, 3.1, 2.8, 3.3, 3.5, 3.0);
// setup the maximum degree of the polynomial
int degree = 5;
// creates regression
PolynomialRegression regression = RegressionBuilder.create(x, y).buildPolynomialRegression(degree);
// prints the coefficients in increasing order of power (from 0 to degree).
Console.log(regression.getCoefficients().toString());
// predicts the Y value with x = 80
Console.log(regression.predict(80)); // emit 2.6
Robust polynomial
(quoted from Robust polynomial regression definition in Wikipedia)
Robust regression is a form of regression analysis designed to overcome some limitations of traditional parametric and non-parametric methods. Regression analysis seeks to find the relationship between one or more independent variables and a dependent variable. Certain widely used methods of regression, such as ordinary least squares, have favourable properties if their underlying assumptions are true, but can give misleading results if those assumptions are not true; thus ordinary least squares is said to be not robust to violations of its assumptions.
Robust regression methods are designed to be not overly affected by violations of assumptions by the underlying data-generating process.
In particular, least squares estimates for regression models are highly sensitive to outliers. While there is no precise definition of an outlier, outliers are observations that do not follow the pattern of the other observations. This is not normally a problem if the outlier is simply an extreme observation drawn from the tail of a normal distribution, but if the outlier results from non-normal measurement error or some other violation of standard ordinary least squares assumptions, then it compromises the validity of the regression results if a non-robust regression technique is used.
The robust polynomial regression model can be represented using the below equation:
y = b0 + b1x1 + b2x12 + * b2x13 +...... bnx1n
Creating a robust polynomial regression
Charba provides a builder to create a robust polynomial regression, passing the samples, in order to enable the use to predict values.
// creates samples
List<Double> x = Arrays.asList(50D, 50D, 70D, 70D, 80D, 80D, 90D, 90D, 100D, 100D);
List<Double> y = Arrays.asList(2.8, 2.9, 2.3, 2.1, 2.5, 2.4, 3.0, 2.8, 3.3, 3.0);
// setup the maximum degree of the polynomial
int degree = 2;
// creates regression
RobustPolynomialRegression regression = RegressionBuilder.create(x, y).buildRobustPolynomialRegression(degree);
// prints the coefficients in increasing order of power (from 0 to degree).
Console.log(regression.getCoefficients().toString()); // emit [0.6666666666666661,0.023333333333333338]
// predicts the Y value with x = 80
Console.log(regression.predict(80)); // emit 2.533333333333333
TheilSen
(quoted from TheilSen regression definition in Wikipedia)
In TheilSen Regression, the estimation of the model is done by calculating the slopes and intercepts of a subpopulation of all possible combinations of subsample points. The final slope and intercept is then defined as the spatial median of these slopes and intercepts.
This regression can be computed efficiently, and is insensitive to outliers. It can be significantly more accurate than non-robust simple linear regression (least squares) for skewed and heteroskedastic data, and competes well against least squares even for normally distributed data in terms of statistical power. It has been called "the most popular nonparametric technique for estimating a linear trend".
The TheilSen regression model can be represented using the below equation:
y = a0 + a1x
Creating a TheilSen regression
Charba provides a builder to create a TheilSen regression, passing the samples, in order to enable the use to predict values.
// creates samples
List<Double> x = Arrays.asList(0.5D, 1D, 1.5D, 2D, 2.5D);
List<Double> y = Arrays.asList(0D, 1D, 2D, 3D, 4D);
// creates regression
TheilSenRegression regression = RegressionBuilder.create(x, y).buildTheilSenRegression();
// coefficients
Console.log(regression.getSlope()); // emit 2
Console.log(regression.getIntercept()); // emit -1
Console.log(regression.getCoefficients().toString()); // emit [-1, 2]
// predicts the Y value with x = 3
Console.log(regression.predict(3)); // emit 5
// computes the X value with Y = 3.5
Console.log(regression.computeX(3.5)); // emit 2.25