Line chart
(quoted from Line chart definition in Wikipedia)
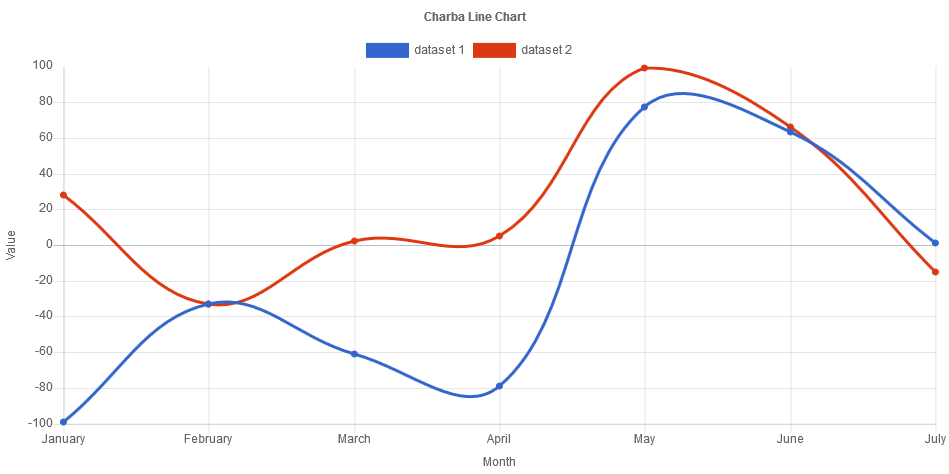
A line chart is a type of chart which displays information as a series of data or data points connected by straight line segments. It is a basic type of chart common in many fields. The measurement points are ordered (typically by their x-axis value) and joined with straight line segments. A line chart is often used to visualize a trend in data over intervals of time, a time series, thus the line is often drawn chronologically.
Programmatically, you could use a line chart as following:
// creates the chart
LineChart chart = new LineChart();
// adds to DOM
component.add(chart);
...
// example for Elemental2
// gets the chart instance as DOM element
Element element = chart.getChartElement().as();
// adds to DOM
DomGlobal.document.body.appendChild(element);
By UIBinder (ONLY for GWT), you could use a line chart as following:
<ui:UiBinder xmlns:ui="urn:ui:com.google.gwt.uibinder"
   xmlns:g="urn:import:com.google.gwt.user.client.ui"
   xmlns:c="urn:import:org.pepstock.charba.client.gwt.widgets">

   <g:HTMLPanel  width="100%">
      ....
      <c:LineChartWidget ui:field="chart"/>
      ...
   </g:HTMLPanel>
</ui:UiBinder>
Dataset
The line chart allows to define the data and a number of properties, used to display the data, by a line dataset.
Every chart has got a method to create a typed dataset accordingly with the chart type. The dataset can be also created instantiating the constructor.
// creates the chart
LineChart chart = new LineChart();
// creates the dataset
LineDataset dataset = chart.newDataset();
// sets the option
dataset.setBackgroundColor(HtmlColor.RED);
...
// creates the dataset
LineDataset datasetNew = new LineDataset();
// sets the option
datasetNew.setBackgroundColor(HtmlColor.RED);
...
// sets the datasets to the chart
chart.getData().setDatasets(dataset, datasetNew);
The following are the attributes that you can set:
| Name | Type | Scriptable | Description |
|---|---|---|---|
| backgroundColor | String - IsColor - Pattern - Gradient | Yes | The fill color/pattern under the line. |
| borderCapStyle | CapStyle | Yes | Cap style of the line. See MDN. |
| borderColor | String - IsColor - Gradient | Yes | The color of the line. |
| borderDash | int[] | Yes | Length and spacing of dashes. See MDN. |
| borderDashOffset | double | Yes | Offset for line dashes. See MDN. |
| borderJoinStyle | JoinStyle | Yes | Line joint style. See MDN. |
| borderWidth | int | Yes | The width of the line in pixels. |
| cubicInterpolationMode | CubicInterpolationMode | Yes | Algorithm used to interpolate a smooth curve from the discrete data points. |
| clip | boolean - double - Clip | - | How to clip relative to chart area. Positive value allows overflow, negative value clips that many pixels inside chart area. |
| drawActiveElementsOnTop | boolean | Yes | Draw the active points of a dataset over the other points of the dataset. |
| fill | String - int - boolean - IsFill | Yes | How to fill the area under the line. See Filling modes. |
| hoverBackgroundColor | String - IsColor - Pattern - Gradient | Yes | The fill color/pattern under the line, when hovered. |
| hoverBorderCapStyle | CapStyle | Yes | Cap style of the line, when hovered. See MDN. |
| hoverBorderColor | String - IsColor - Gradient | Yes | The color of the line, when hovered. |
| hoverBorderDash | int[] | Yes | Length and spacing of dashes, when hovered. See MDN. |
| hoverBorderDashOffset | int | Yes | Offset for line dashes, when hovered. See MDN. |
| hoverBorderJoinStyle | JoinStyle | Yes | Line joint style, when hovered. See MDN. |
| hoverBorderWidth | int | Yes | The width of the line in pixels, when hovered. |
| indexAxis | IndexAxis | - | The base axis of the dataset. 'IndexAxis.X' for horizontal lines and 'IndexAxis.Y' for vertical lines. |
| label | String | - | The label for the dataset which appears in the legend and tooltips. |
| normalized | boolean | - | If true, you provide data with indices that are unique, sorted, and consistent across data sets and provide the normalized. |
| order | int | - | The drawing order of dataset. Also affects order for stacking, tooltip, and legend. |
| parsing | boolean | - | If false, the data set parsing is disable. If parsing is disabled, data must be sorted and in the formats the associated chart type and scales use internally. |
| pointBackgroundColor | String[] - IsColor[] - Gradient[] | Yes | The fill color for points. |
| pointBorderColor | String[] - IsColor[] - Gradient[] | Yes | The border color for points. |
| pointBorderWidth | int[] | Yes | The width of the point border in pixels. |
| pointHitRadius | double[] | Yes | The pixel size of the non-displayed point that reacts to mouse events. |
| pointHoverBackgroundColor | String[] - IsColor[] - Gradient[] | Yes | Point background color when hovered. |
| pointHoverBorderColor | String[] - IsColor[] - Gradient[] | Yes | Point border color when hovered. |
| pointHoverBorderWidth | int[] | Yes | Border width of point when hovered. |
| pointHoverRadius | double[] | Yes | The radius of the point when hovered. |
| pointRadius | double[] | Yes | The radius of the point shape. If set to 0, the point is not rendered. |
| pointRotation | double[] | Yes | The rotation of the point in degrees. |
| pointStyle | PointStyle[] - Img[] - Canvas[] | Yes | Style of the point. |
| showLine | boolean | - | If false, the line is not drawn for this dataset. |
| spanGaps | boolean - double | - | If true, lines will be drawn between points with no or null data. If false, points with NaN data will create a break in the line. Can also be a number specifying the maximum gap length to span. The unit of the value depends on the scale used. |
| stepped | boolean - Stepped | Yes | If the line is shown as a stepped line. |
| tension | double | - | Bezier curve tension of the line. Set to 0 to draw straight lines. This option is ignored if monotone cubic interpolation is used. |
| xAxisID | String | - | The ID of the x axis to plot this dataset on. |
| yAxisID | String | - | The ID of the y axis to plot this dataset on. |
General
The general options for a line dataset can control behaviors not related to styling or interactions and they are the following:
| Name | Defaults | Description |
|---|---|---|
| clip | Undefined.DOUBLE | How to clip relative to chart area. |
| drawActiveElementsOnTop | true | Draw the active points of a dataset over the other points of the dataset. |
| indexAxis | IndexAxis.X | The base axis of the dataset. |
| label | null | The label for the dataset which appears in the legend and tooltips. |
| normalized | false | If true, you provide data with indices that are unique, sorted, and consistent across data sets and provide the normalized. |
| order | 0 | The drawing order of dataset. Also affects order for stacking, tooltip, and legend. |
| parsing | true | If false, the data set parsing is disable. If parsing is disabled, data must be sorted and in the formats the associated chart type and scales use internally. |
| xAxisID | DefaultScaleId.X | The ID of the x axis to plot this dataset on. |
| yAxisID | DefaultScaleId.Y | The ID of the y axis to plot this dataset on. |
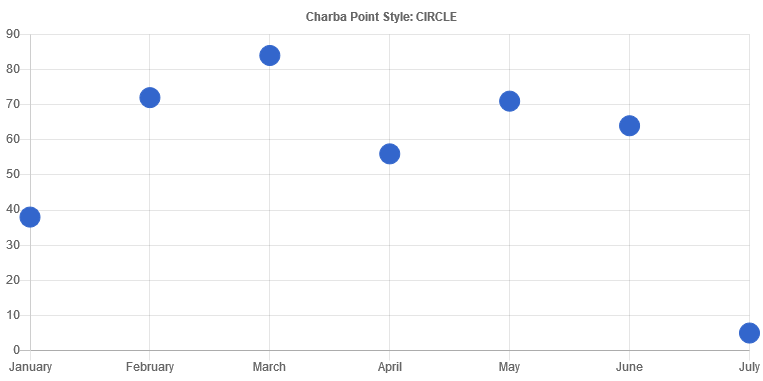
Point styling
The style of each point of the dataset can be configured by the following properties:
| Name | Description |
|---|---|
| pointBackgroundColor | The fill color for points. |
| pointBorderColor | The border color for points. |
| pointBorderWidth | The width of the point border in pixels. |
| pointHitRadius | The pixel size of the non-displayed point that reacts to mouse events. |
| pointRadius | The radius of the point shape. |
| pointRotation | The rotation of the point in degrees. |
| pointStyle | Style of the point. |
All above options have got the fallback to the associated Point elements, retrievable by the following statements:
// from chart instance
Point point = chart.getOptions().getElements().getPoint();
// sets options for all line datasets of the chart
point.setRadius(6);
...
// from defaults
Point defaultPoint  = Defaults.get().getGlobal().getElements().getPoint();
// sets options for all line datasets of all charts
defaultPoint.setRadius(6);
Line styling
The style of each line of the dataset can be configured by the following properties:
| Name | Description |
|---|---|
| backgroundColor | The fill color under the line. |
| borderCapStyle | Cap style of the line. |
| borderColor | The color of the line. |
| borderDash | Length and spacing of dashes. |
| borderDashOffset | Offset for line dashes. |
| borderJoinStyle | Line joint style |
| borderWidth | The width of the line in pixels. |
| cubicInterpolationMode | Algorithm used to interpolate a smooth curve from the discrete data points. |
| fill | How to fill the area under the line. |
| stepped | If the line is shown as a stepped line. |
| tension | Bezier curve tension of the line. |
All above options have got the fallback to the associated Line elements, retrievable by the following statements:
// from chart instance
Line line = chart.getOptions().getElements().getLine();
// sets options for all line datasets of the chart
line.setBorderWidth(6);
...
// from defaults
Line defaultLine  = Defaults.get().getGlobal().getElements().getLine();
// sets options for all line datasets of all charts
defaultLine.setBorderWidth(6);
Point interactions
The interaction with each point can be controlled with the following properties:
| Name | Description |
|---|---|
| pointHoverBackgroundColor | Point background color when hovered. |
| pointHoverBorderColor | Point border color when hovered. |
| pointHoverBorderWidth | Border width of point when hovered. |
| pointHoverRadius | The radius of the point when hovered. |
All above options have got the fallback to the associated Point elements, retrievable by the following statements:
// from chart instance
Point point = chart.getOptions().getElements().getPoint();
// sets options for all line datasets of the chart
point.setRadius(6);
...
// from defaults
Point defaultPoint  = Defaults.get().getGlobal().getElements().getPoint();
// sets options for all line datasets of all charts
defaultPoint.setRadius(6);
Line interactions
The interaction with each line can be controlled with the following properties:
| Name | Description |
|---|---|
| hoverBackgroundColor | The fill color under the line, when hovered. |
| hoverBorderCapStyle | Cap style of the line, when hovered. |
| hoverBorderColor | The color of the line, when hovered. |
| hoverBorderDash | Length and spacing of dashes, when hovered. |
| hoverBorderDashOffset | Offset for line dashes, when hovered. |
| hoverBorderJoinStyle | Line joint style, when hovered. |
| hoverBorderWidth | The width of the line in pixels, when hovered. |
All above options have got the fallback to the associated Line elements, retrievable by the following statements:
// from chart instance
Line line = chart.getOptions().getElements().getLine();
// sets options for all line datasets of the chart
line.setBorderWidth(6);
...
// from defaults
Line defaultLine  = Defaults.get().getGlobal().getElements().getLine();
// sets options for all line datasets of all charts
defaultLine.setBorderWidth(6);
Scriptable
Scriptable options at dataset level accept a callback which is called for each of the underlying data values. See more details in Configuring charts section.
// creates chart
LineChart chart = new LineChart();
// creates dataset
LineDataset dataset = chart.newDataset();
// sets the option by a callback
dataset.setBackgroundColor(new ColorCallback<DatasetContext>(){

   @Override
   public IsColor invoke(DatasetContext context){
      // logic
      return color;
   }
});
The following options can be set by a callback:
| Name | Callback | Returned types |
|---|---|---|
| backgroundColor | ColorCallback<DatasetContext> | String - IsColor - Pattern - Gradient |
| borderCapStyle | CapStyleCallback<DatasetContext> | CapStyle |
| borderColor | ColorCallback<DatasetContext> | String - IsColor - Gradient |
| borderDash | BorderDashCallback<DatasetContext> | List<Integer> |
| borderDashOffset | BorderDashOffsetCallback<DatasetContext> | double |
| borderJoinStyle | JoinStyleCallback<DatasetContext> | JoinStyle |
| borderWidth | WidthCallback<DatasetContext> | int |
| cubicInterpolationMode | CubicInterpolationModeCallback | CubicInterpolationMode |
| drawActiveElementsOnTop | DrawActiveElementsOnTopCallback | boolean |
| fill | FillCallback | String - int - boolean - IsFill |
| hoverBackgroundColor | ColorCallback<DatasetContext> | String - IsColor - Pattern - Gradient |
| hoverBorderCapStyle | CapStyleCallback<DatasetContext> | CapStyle |
| hoverBorderColor | ColorCallback<DatasetContext> | String - IsColor - Gradient |
| hoverBorderDash | BorderDashCallback<DatasetContext> | List<Integer> |
| hoverBorderDashOffset | BorderDashOffsetCallback<DatasetContext> | int |
| hoverBorderJoinStyle | JoinStyleCallback<DatasetContext> | JoinStyle |
| hoverBorderWidth | WidthCallback<DatasetContext> | int |
| pointBackgroundColor | ColorCallback<DatasetContext> | String - IsColor - Gradient |
| pointBorderColor | ColorCallback<DatasetContext> | String - IsColor - Gradient |
| pointBorderWidth | WidthCallback<DatasetContext> | int |
| pointHitRadius | RadiusCallback<DatasetContext> | double |
| pointHoverBackgroundColor | ColorCallback<DatasetContext> | String - IsColor - Gradient |
| pointHoverBorderColor | ColorCallback<DatasetContext> | String - IsColor - Gradient |
| pointHoverBorderWidth | WidthCallback<DatasetContext> | int |
| pointHoverRadius | RadiusCallback<DatasetContext> | double |
| pointRadius | RadiusCallback<DatasetContext> | double |
| pointRotation | RotationCallback<DatasetContext> | double |
| pointStyle | PointStyleCallback<DatasetContext> | boolean - PointStyle - Img - Canvas |
| stepped | SteppedCallback | Stepped |
Data structure
The data of a dataset for a line chart can be passed in three formats.
Data as doubles
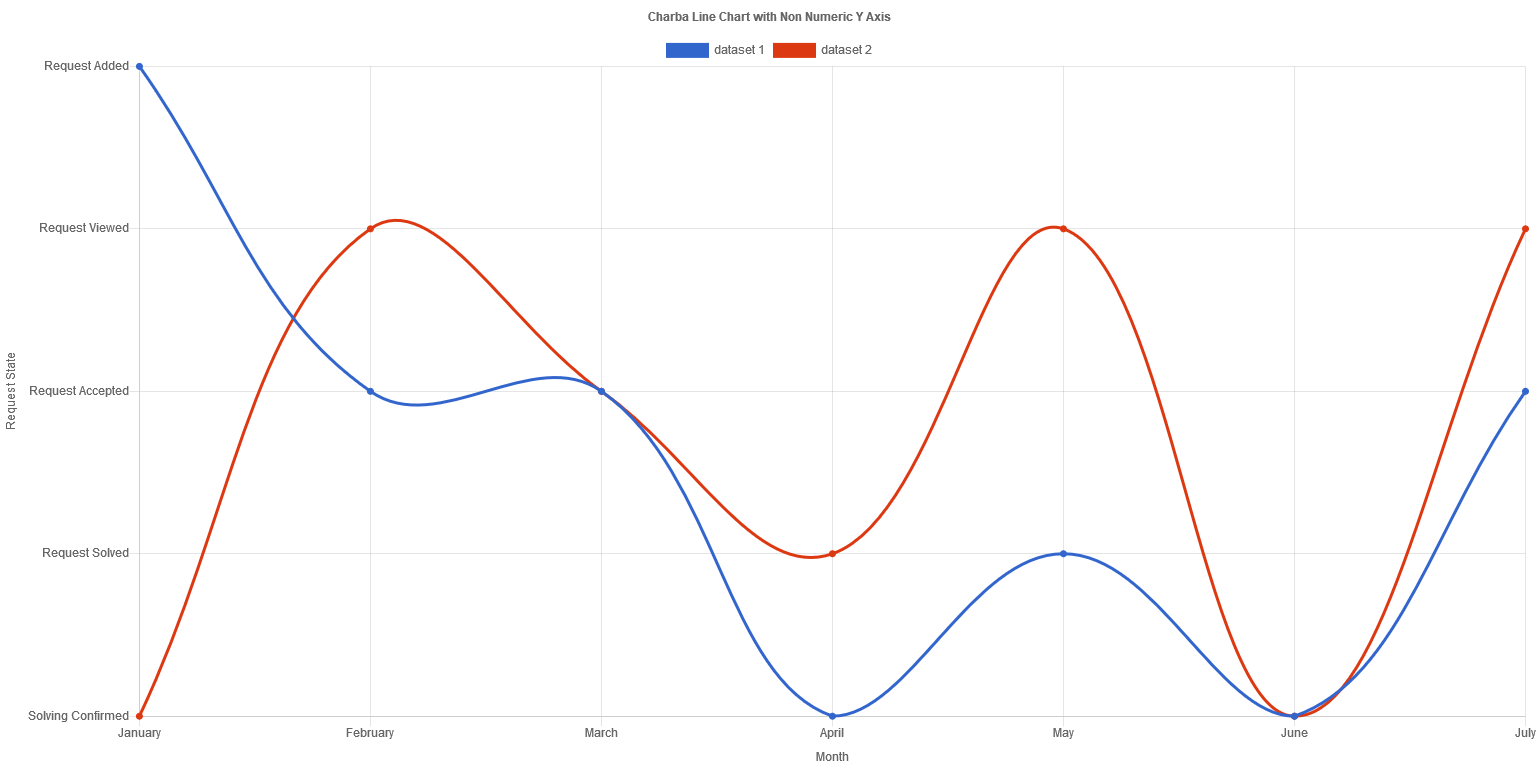
When the data is an array or list of doubles, the x axis is generally a category. The points are placed onto the axis using their position in the array. When a line chart is created with a category axis, the labels property of the data object must be specified.
// sets data as an array of doubles
dataset.setData(1,2,3,4,6);

// sets data as a list of double
List<Double> list = new LinkedList<>();
list.add(1);
list.add(2);
list.add(3);
dataset.setData(list);
Data as DataPoint
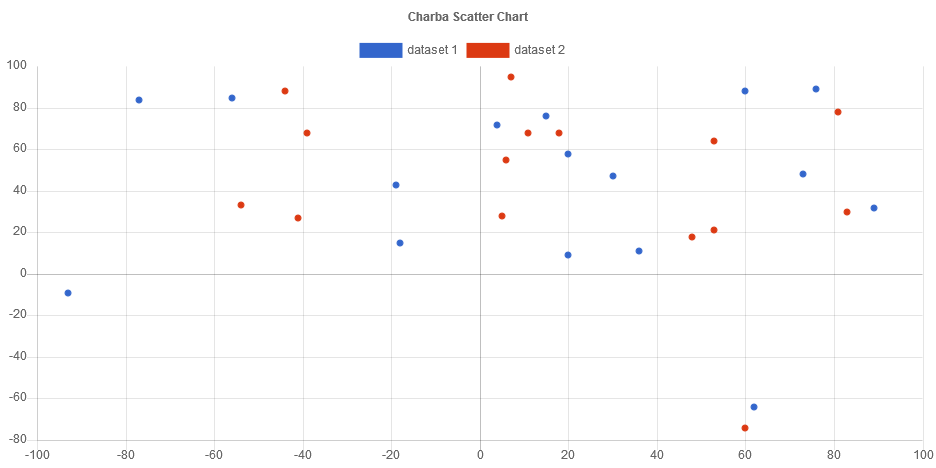
This alternate is used for sparse datasets, such as those in scatter or time series charts. Each data point is specified using an object containing x and y properties (for scatter chart) or containing y and t (as time type) properties for time series.
// creates a datapoint
DataPoint dp1 = new DataPoint();
dp1.setX(10);
dp1.setY(20);
// creates a datapoint
DataPoint dp2 = new DataPoint();
dp2.setX(30);
dp2.setY(40);
// sets data by an array of datapoints
dataset.setDataPoint(dp1, dp2);
Data as strings
You can set data of charts as an array of strings. Each point in the data array corresponds to the label at the same index on the x axis.
...
dataset.setDataString("label1", "label2");
....
Options
The line chart defines specific options implementation to be configured. These options are merged with the global chart configuration options to form the options passed to the chart.
// creates chart
LineChart chart = new LineChart();
// gets the chart options
LineOptions options = chart.getOptions();
// sets options
options.setResponsive(true);
options.setShowLine(false);
These are the options specific to line charts:
| Name | Type | Default | Description |
|---|---|---|---|
| showLine | boolean | true | If false, the lines between points are not drawn. |
| spanGaps | boolean - double | false | If true, lines will be drawn between points with no or null data. If false, points with NaN data will create a break in the line. Can also be a number specifying the maximum gap length to span. The unit of the value depends on the scale used. |
Setting showLine to false:
Segment
The line charts can contain a segment options element which can manage the styles of data sets in each own segment between the points and can override the data set configuration by scriptable options.
// creates chart
LineChart chart = new LineChart();
// sets segment callback for border color
chart.getOptions().getSegment().setBorderColor(new ColorCallback<SegmentContext>() {

    @Override
    public Object invoke(SegmentContext context) {
        // if value of point 1 greater than value of point 0
        // the border color will be "green", otherwise "gray"
        double valuePoint0 = context.getStartPoint().getParsed().getY();
        double valuePoint1 = context.getEndPoint().getParsed().getY();
        return valuePoint0 < valuePoint1 ? HtmlColor.GRAY : HtmlColor.GREEN;
    }
});
// sets segment callback for background color
chart.getOptions().getSegment().setBackgroundColor(new ColorCallback<SegmentContext>() {

    @Override
    public Object invoke(SegmentContext context) {
        // if value of point 1 greater than value of point 0
        // the background color will be "light green", otherwise "gray"
        double valuePoint0 = context.getStartPoint().getParsed().getY();
        double valuePoint1 = context.getEndPoint().getParsed().getY();
        return valuePoint0 < valuePoint1 ? HtmlColor.LIGHT_GRAY : HtmlColor.LIGHT_GREEN;
    }
});
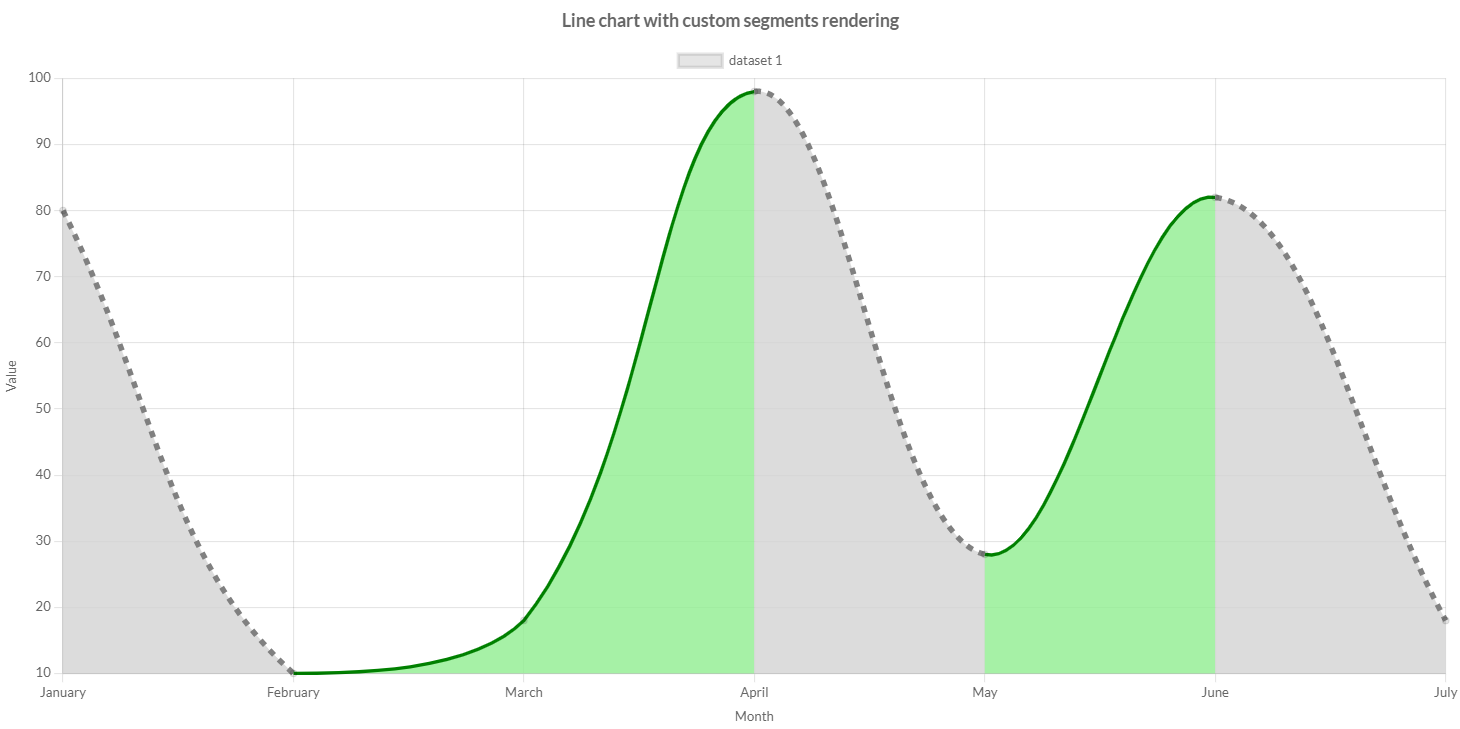
Currently all of the border options and background color are supported. The segment styles are resolved for each section of the line between each point.
These are the options specific to line charts:
| Name | Callback | Returned types |
|---|---|---|
| backgroundColor | ColorCallback<SegmentContext> | String - IsColor - Pattern |
| borderCapStyle | CapStyleCallback<SegmentContext> | CapStyle |
| borderColor | ColorCallback<SegmentContext> | String - IsColor |
| borderDash | BorderDashCallback<SegmentContext> | List<Integer> |
| borderDashOffset | BorderDashOffsetCallback<SegmentContext> | double |
| borderJoinStyle | JoinStyleCallback<SegmentContext> | JoinStyle |
| borderWidth | WidthCallback<SegmentContext> | int |
The callbacks are getting the only 1 argument, the segment context which contains the context of the callback execution.
The context object contains the following properties:
| Name | Type | Description |
|---|---|---|
| attributes | NativeObjectContainer | User object which you can store your options at runtime. |
| chart | IsChart | Chart instance. |
| datasetIndex | int | The index of the dataset. |
| endDataIndex | int | The index of second point in the data. |
| endPoint | PointElement | The line element for the end point of the segment. |
| startDataIndex | int | The index of first point in the data. |
| startPoint | PointElement | The line element for the start point of the segment. |
| type | ContextType | The type of the context. It can be ONLY ContextType.SEGMENT. |