Sankey chart
(quoted from Sankey chart definition in Wikipedia)
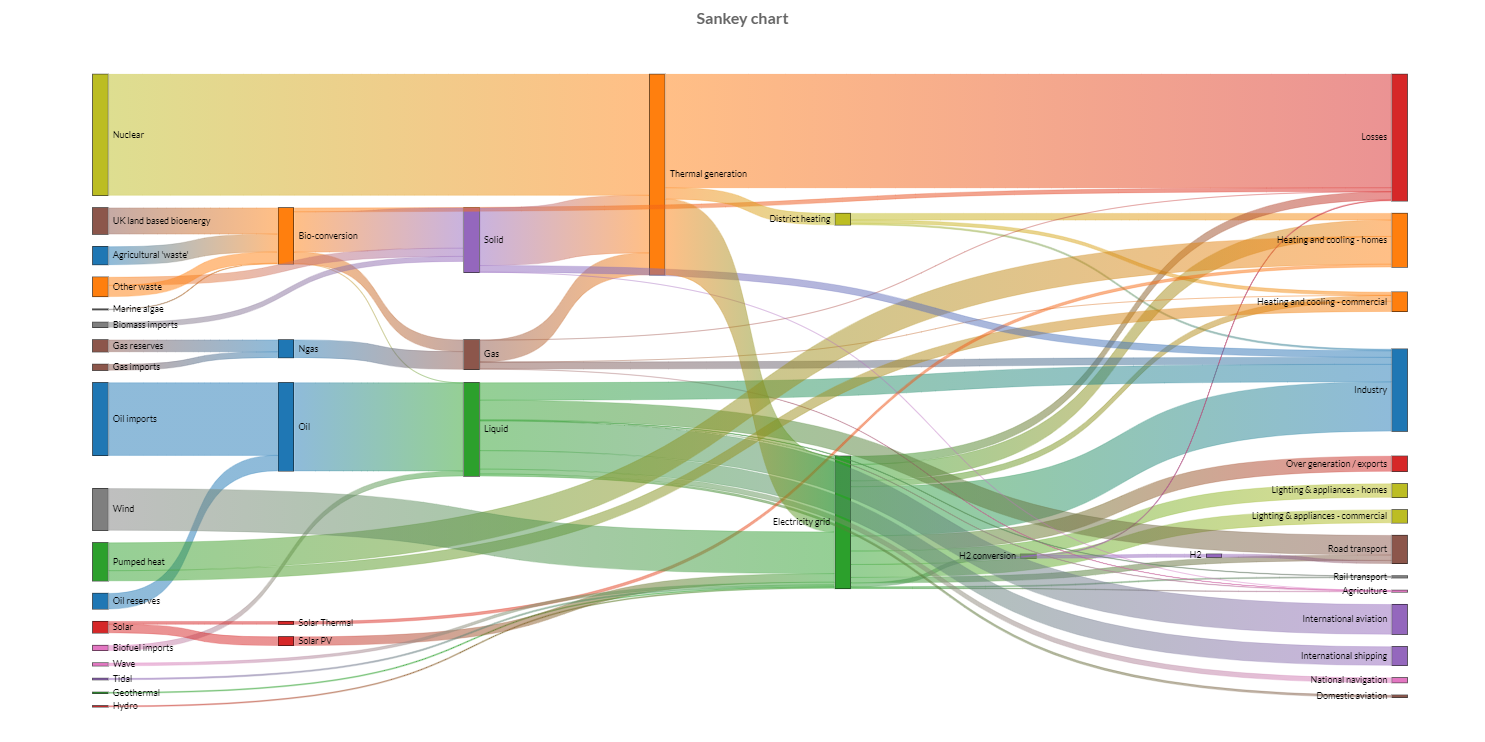
Sankey charts are a type of flow diagram in which the width of the arrows is proportional to the flow rate.
The illustration shows a sankey chart that represents all the primary energy that flows into a factory. The widths of the bands are linearly proportional to energy production, utilization and loss. The primary energy inputs enter the left side of the diagram, and are differentiated into gas, electricity and coal/oil.
Sankey diagrams can also visualize the energy accounts, material flow accounts on a regional or national level, and cost breakdowns, and emphasize the major transfers or flows within a system. They help locate the most important contributions to a flow. They often show conserved quantities within defined system boundaries.
Charba provides out of the box the feature to enable sankey chart, leveraging on Chart.js Sankey.
The Chart.js Sankey is native javascript implementation and Charba provides the wrapper in order to be able to use it.
Programmatically, you could use a bar chart as following:
// creates the chart
SankeyChart chart = new SankeyChart();
// adds to DOM
component.add(chart);
...
// example for Elemental2
// gets the chart instance as DOM element
Element element = chart.getChartElement().as();
// adds to DOM
DomGlobal.document.body.appendChild(element);
By UIBinder (ONLY for GWT), you could use a bar chart as following:
<ui:UiBinder xmlns:ui="urn:ui:com.google.gwt.uibinder"
   xmlns:g="urn:import:com.google.gwt.user.client.ui"
   xmlns:c="urn:import:org.pepstock.charba.client.gwt.widgets">

   <g:HTMLPanel  width="100%">
      ....
      <c:SankeyChartWidget ui:field="chart"/>
      ...
   </g:HTMLPanel>
</ui:UiBinder>
Controller registration
The controller registration is performed when a first SANKEY chart has been instantiated. When there is a use case where some defaults options must be set before the first instantiation, you need to register the controller before changing the default options.
// registers the controller
SankeyChart.register();
// gets default options
GlobalOptions gOptions = Defaults.get().getGlobal();
// gets default sankey element options
SankeyElementOptions defaultOptions = gOptions.getElements().getElement(SankeyElementOptions.FACTORY);
// sets default value
defaultOptions.setColorMode(ColorMode.GRADIENT);
Dataset
The sankey chart allows to define the data and a number of properties, used to display the data, by a sankey dataset.
Every chart has got a method to create a typed dataset accordingly with the chart type. The dataset can be also created instantiating the constructor.
// creates the chart
SankeyChart chart = new SankeyChart();
// creates the dataset
SankeyDataset dataset = chart.newDataset();
// sets the option
dataset.setColorMode(ColorMode.GRADIENT);
...
// creates the dataset
SankeyDataset datasetNew = new SankeyDataset();
// sets the option
datasetNew.setColorMode(ColorMode.GRADIENT);
...
// sets the dataset to the chart
chart.getData().setDatasets(dataset);
The following are the attributes that you can set:
| Name | Type | Default | Scriptable | Description |
|---|---|---|---|---|
| borderColor | String - IsColor | HtmlColor.BLACK - | - | The color of the node border. |
| borderWidth | int | 1 | - | The stroke width of the sankey nodes in pixels. |
| color | String - IsColor | HtmlColor.BLACK - | - | The color of the node label. |
| colorFrom | String[] - IsColor[] | empty list | Yes | The starting color of the flow between nodes. |
| colorMode | ColorMode | ColorMode.GRADIENT | Yes | How the flow is drawn on the chart. |
| colorTo | String[] - IsColor[] | empty list | Yes | The ending color of the flow between nodes. |
| column | Column | null | - | Is a map to apply a specific position, by column number, to the nodes, affecting the chart layout. |
| font | IsFont | Defaults.get().getGlobal().getFont() | Yes | Font of text of node label. See Font. |
| hoverColorFrom | String[] - IsColor[] | empty list | Yes | The starting color of the flow between nodes, when hovered. |
| hoverColorTo | String[] - IsColor[] | empty list | Yes | The ending color of the flow between nodes, when hovered. |
| labels | Labels | null | - | Is a map to apply a different label to the nodes. |
| nodeWidth | int | 10 | - | The width of node. |
| padding | double | font.getLineheight() / 2 | Yes | The padding of the node label from the top. |
| priority | Priority | null | - | Is a map to apply a different priority to the nodes, affecting the chart layout. |
| size | Size | Size.MAX | Yes | Sets Size.MIN if flow overlap is preferred. |
Scriptable
Scriptable options at dataset level accept a callback which is called for each of the underlying data values. See more details in Configuring charts section.
// creates chart
SankeyChart chart = new SankeyChart();
// creates dataset
SankeyDataset dataset = chart.newDataset();
// sets the option by a callback
dataset.setColorFrom(new ColorCallback<DatasetContext>(){

   @Override
   public IsColor invoke(DatasetContext context){
      // logic
      return color;
   }
});
The following options can be set by a callback:
| Name | Callback | Returned types |
|---|---|---|
| colorFrom | ColorCallback<DatasetContext> | String - IsColor |
| colorMode | ColorModeCallback | ColorMode |
| colorTo | ColorCallback<DatasetContext> | String - IsColor |
| font | FontCallback<DatasetContext> | FontItem |
| hoverColorFrom | ColorCallback<DatasetContext> | String - IsColor |
| hoverColorTo | ColorCallback<DatasetContext> | String - IsColor |
| padding | PaddingCallback | double |
| size | SizeCallback | Size |
Data structure
The data of a dataset for a sankey chart can be passed in sankey data points.
The setData method is available but you can NOT use them otherwise an exception will throw.
Use setDataPoints instead.
Data as objects
Sankey data should be provided by a list of objects. The sankey data point contains the relations between nodes and their value.
It needs to have from and to values, which represent the nodes, and value which represents the value of the sankey element.
// creates chart
SankeyChart chart = new SankeyChart();
// creates dataset
SankeyDataset dataset = chart.newDataset();
// creates a list of data points
List<SankeyDataPoint> datapoints = dataset1.getDataPoints(true);
datapoints.add(new SankeyDataPoint("a", "b", 20));
datapoints.add(new SankeyDataPoint("c", "d", 10));
datapoints.add(new SankeyDataPoint("c", "e", 5));
// stores datapoints to dataset
dataset.setDataPoints(datapoints);
Options
The sankey chart defines specific options implementation to be configured.
// creates chart
SankeyChart chart = new SankeyChart();
// gets the chart options
SankeyOptions options = chart.getOptions();
// gets sankey element options
SankeyElementOptions sankeyOptions = options.getElements().getElement(SankeyElementOptions.FACTORY);
// sets value
sankeyOptions.setColorMode(ColorMode.GRADIENT);

// ------------------------
// DEFAULTS
// ------------------------
// gets default options
GlobalOptions gOptions = Defaults.get().getGlobal();
// gets default sankey element options
SankeyElementOptions defaultOptions = gOptions.getElements().getElement(SankeyElementOptions.FACTORY);
// sets default value
defaultOptions.setColorMode(ColorMode.GRADIENT);
The sankey chart disables the DATALABELS, LABELS, ANNOTATION, HTML legend, color schemes and dataset items selector plugins.
Scales
The sankey chart can use cartesian linear axes and they are not showed.