Matrix chart
(quoted from Matrix chart definition in Wikipedia)
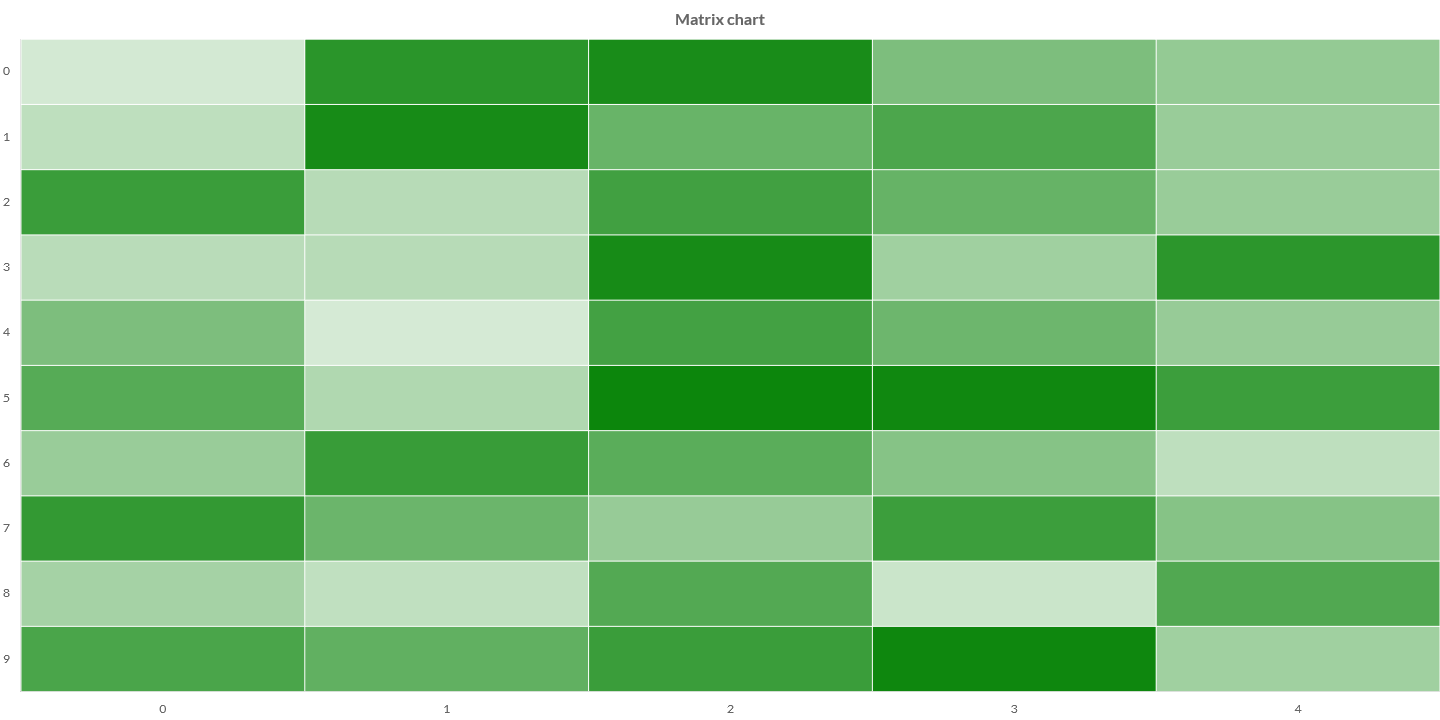
A matrix chart is a data visualization technique that shows magnitude of a phenomenon as color in two dimensions. The variation in color may be by hue or intensity, giving obvious visual cues to the reader about how the phenomenon is clustered or varies over space.
Matrix originated in 2D displays of the values in a data matrix. Larger values were represented by darker colored squares and smaller values by lighter colored squares.
Charba provides out of the box the feature to enable matrix chart, leveraging on Chart.js Matrix.
The Chart.js Matrix is native javascript implementation and Charba provides the wrapper in order to be able to use it.
Programmatically, you could use a bar chart as following:
// creates the chart
MatrixChart chart = new MatrixChart();
// adds to DOM
component.add(chart);
...
// example for Elemental2
// gets the chart instance as DOM element
Element element = chart.getChartElement().as();
// adds to DOM
DomGlobal.document.body.appendChild(element);
By UIBinder (ONLY for GWT), you could use a bar chart as following:
<ui:UiBinder xmlns:ui="urn:ui:com.google.gwt.uibinder"
   xmlns:g="urn:import:com.google.gwt.user.client.ui"
   xmlns:c="urn:import:org.pepstock.charba.client.gwt.widgets">

   <g:HTMLPanel  width="100%">
      ....
      <c:MatrixChartWidget ui:field="chart"/>
      ...
   </g:HTMLPanel>
</ui:UiBinder>
Controller registration
The controller registration is performed when a first MATRIX chart has been instantiated. When there is a use case where some defaults options must be set before the first instantiation, you need to register the controller before changing the default options.
// registers the controller
MatrixChart.register();
// gets default options
GlobalOptions gOptions = Defaults.get().getGlobal();
// gets default matrix element options
MatrixElementOptions defaultOptions = gOptions.getElements().getElement(MatrixElementOptions.FACTORY);
// sets default value
defaultOptions.setBorderColor(HtmlColor.RED);
Dataset
The matrix chart allows to define the data and a number of properties, used to display the data, by a matrix dataset.
Every chart has got a method to create a typed dataset accordingly with the chart type. The dataset can be also created instantiating the constructor.
// creates the chart
MatrixChart chart = new MatrixChart();
// creates the dataset
MatrixDataset dataset = chart.newDataset();
// sets the option
dataset.setBackgroundColor(HtmlColor.RED);
...
// creates the dataset
MatrixDataset datasetNew = new MatrixDataset();
// sets the option
datasetNew.setBackgroundColor(HtmlColor.RED);
...
// sets the dataset to the chart
chart.getData().setDatasets(dataset);
The following are the attributes that you can set:
| Name | Type | Default | Scriptable | Description |
|---|---|---|---|---|
| backgroundColor | String - IsColor | Defaults.get().getGlobal().getBackgroundColorAsString() | Yes | The fill color/pattern of the matrix element. |
| borderColor | String - IsColor | Defaults.get().getGlobal().getBorderColorAsString() | Yes | The color of the matrix element border. |
| borderRadius | int - BarBorderRadius | 0 | Yes | The border radius (in pixels) of matrix element. |
| borderWidth | int - BarBorderWidth | 0 | Yes | The stroke width of the matrix element in pixels. |
| height | double | 20 | Yes | The height of matrix element. |
| hoverBackgroundColor | String - IsColor | Defaults.get().getGlobal().getBackgroundColorAsString() | Yes | The fill color/pattern of the matrix elements when hovered. |
| hoverBorderColor | String - IsColor | Defaults.get().getGlobal().getBorderColorAsString() | Yes | The stroke color of the matrix elements when hovered. |
| hoverBorderWidth | int - BarBorderWidth | 0 | Yes | The stroke width of the matrix elements when hovered. |
| width | double | 20 | Yes | The width of matrix element. |
| xAnchor | Anchor | Anchor.CENTER | - | Set the horizontal anchor value of the matrix elements. For this property, only Anchor.LEFT, Anchor.RIGHT and Anchor.CENTER are valid. |
| yAnchor | Anchor | Anchor.CENTER | - | Set the vertical anchor value of the matrix elements. For this property, only Anchor.TOP, Anchor.BOTTOM and Anchor.CENTER are valid. |
Scriptable
Scriptable options at dataset level accept a callback which is called for each of the underlying data values. See more details in Configuring charts section.
// creates chart
MatrixChart chart = new MatrixChart();
// creates dataset
MatrixDataset dataset = chart.newDataset();
// sets the option by a callback
dataset.setBackgroundColor(new ColorCallback<DatasetContext>(){

   @Override
   public IsColor invoke(DatasetContext context){
      // logic
      return color;
   }
});
The following options can be set by a callback:
| Name | Callback | Returned types |
|---|---|---|
| backgroundColor | ColorCallback<DatasetContext> | String - IsColor - Pattern - Gradient |
| borderColor | ColorCallback<DatasetContext> | String - IsColor - Gradient |
| borderRadius | BorderRadiusCallback<DatasetContext> | int - BarBorderRadius |
| borderWidth | BarBorderWidthCallback | int - BarBorderWidth |
| height | SizeCallback | double |
| hoverBackgroundColor | ColorCallback<DatasetContext> | String - IsColor - Pattern - Gradient |
| hoverBorderColor | ColorCallback<DatasetContext> | String - IsColor - Gradient |
| hoverBorderWidth | BarBorderWidthCallback | int - BarBorderWidth |
| width | SizeCallback | double |
Data structure
The data of a dataset for a matrix chart can be passed in matrix data points.
The setData method is available but you can NOT use them otherwise an exception will throw.
Use setDataPoints instead.
Data as objects
Matrix data should be provided by a list of objects. The matrix data point needs to have x and y values to bind to the axes to set, and value which represents the value of the matrix element.
// creates chart
MatrixChart chart = new MatrixChart();
// creates dataset
MatrixDataset dataset = chart.newDataset();
// creates a list of data points
List<MatrixDataPoint> points = new LinkedList<>();
// creates the start and end dates
Date end = adapter.startOf(new Date(), TimeUnit.DAY);
Date start = adapter.add(end, -365, TimeUnit.DAY);
// for each day, it creates a data point
while (start.getTime() <= end.getTime()) {
    // x is the date in ISO format, y is the week of the day, and then the value
    MatrixDataPoint point = new MatrixDataPoint(adapter.format(start, "yyyy-MM-dd")
        , adapter.format(start, "EEE")
        , getRandomDigit(0, 100));
    // adds to the list
    points.add(point);
    // increments the date of 1 day
    start = adapter.add(start, 1, TimeUnit.DAY);
}
// stores datapoints to dataset
dataset.setDataPoints(points);
Options
The matrix chart defines specific options implementation to be configured.
// creates chart
MatrixChart chart = new MatrixChart();
// gets the chart options
MatrixOptions options = chart.getOptions();
// gets matrix element options
MatrixElementOptions matrixOptions = options.getElements().getElement(MatrixElementOptions.FACTORY);
// sets value
matrixOptions.setBorderColor(HtmlColor.RED);

// ------------------------
// DEFAULTS
// ------------------------
// gets default options
GlobalOptions gOptions = Defaults.get().getGlobal();
// gets default matrix element options
MatrixElementOptions defaultOptions = gOptions.getElements().getElement(MatrixElementOptions.FACTORY);
// sets default value
defaultOptions.setBorderColor(HtmlColor.RED);
The matrix chart disables the LABELS plugin.
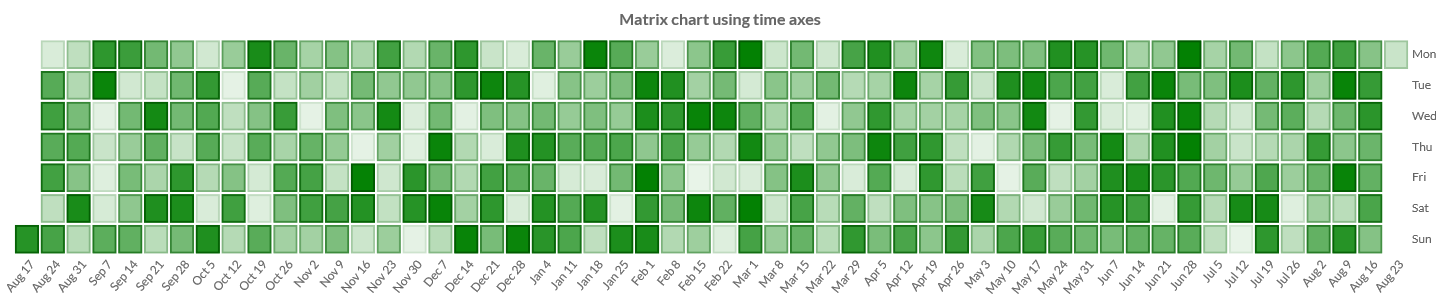
Scales
The matrix chart can use cartesian time, linear or category axes.