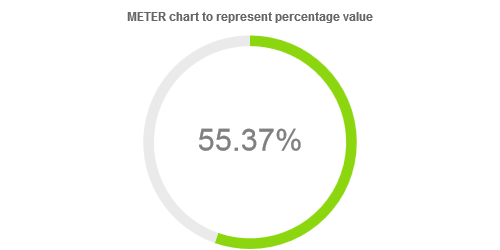
Meter chart
A meter chart is Charba extension of doughnut chart, by a controller implementation.
The meter charts are divided in the 2 segments, the arc of each segment shows the proportional value of data.
Programmatically, you could use a meter chart as following:
// creates the chart
MeterChart chart = new MeterChart();
// adds to DOM
component.add(chart);
...
// example for Elemental2
// gets the chart instance as DOM element
Element element = chart.getChartElement().as();
// adds to DOM
DomGlobal.document.body.appendChild(element);
By UIBinder (ONLY for GWT), you could use a meter chart as following:
<ui:UiBinder xmlns:ui="urn:ui:com.google.gwt.uibinder"
   xmlns:g="urn:import:com.google.gwt.user.client.ui"
   xmlns:c="urn:import:org.pepstock.charba.client.gwt.widgets">

   <g:HTMLPanel  width="100%">
      ....
      <c:MeterChartWidget ui:field="chart"/>
      ...
   </g:HTMLPanel>
</ui:UiBinder>
Dataset
The meter chart allows a number of properties to be specified for the meter dataset.
// creates the chart
MeterChart chart = new MeterChart();
// creates the dataset
MeterDataset dataset = chart.newDataset();
// sets the value
dataset.setValue(90.5D);
// sets the dataset to the chart
chart.getData().setDatasets(dataset);
The following are the attributes that you can set:
| Name | Type | Default | Description |
|---|---|---|---|
| borderColor | String - IsColor | color option value | The border color of the arcs in the dataset. |
| borderRadius | int - ArcBorderRadius | 0 | The arc border radius (in pixels). |
| borderWidth | int | 0 | The border width of the arcs in the dataset. |
| color | String[] - IsColor[] | rgb(140,214,16) - | The color to fill the segment of the chart which represents the value. |
| emptyColor | String[] - IsColor[] | rgb(234,234,234) - | The color to fill the segment of the chart which represents the empty part. |
| max | double | 0 | The maximum value for the dataset. |
A meter chart can have ONLY 1 dataset.
The dataset can be created instantiating the constructor, passing the maximum value of chart. The maximum value can be also changed at runtime.
The default value of maximum value is 100.
// sets max value
int maxValue = 200;
// creates the chart
MeterChart chart = new MeterChart();
// creates the dataset with new max value
MeterDataset dataset = chart.newDataset(maxValue);
// sets the value
dataset.setValue(90.5D);
// sets the dataset to the chart
chart.getData().setDatasets(dataset);
Labels
The meter charts allow you to set labels inside the chart in order to improve the understanding of the chart for the user.
There are 2 possible labels you can set in the chart:
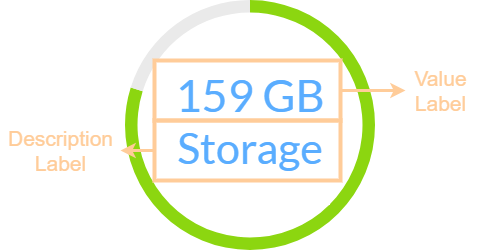
Value label
The value label allows you to show the value or percentage inside the chart.
// creates the dataset
MeterDataset dataset = chart.newDataset();
// sets the percentage rendering
dataset.getValueLabel().setPercentage(true);
The value label element contains all options in order to configure the rendering.
The following are the attributes that you can set:
| Name | Type | Default | Scriptable | Description |
|---|---|---|---|---|
| animated | boolean | false | - | If the rendered label will be shown based on the animation of chart. |
| autoFontSize | boolean | true | - | If true, the font size to applied to the rendered label is automatically calculated at runtime, otherwise uses the size property of the font. |
| color | IsColor | rgb(128, 128, 128) - | Yes | Color of the content. |
| display | boolean | true | - | If true, the value label is shown. |
| font | IsFont | null | Yes | Font of rendered label. If autoFontSize is set to true, the size property is ignored because automatically calculated at runtime.The default value is the font instance in the chart options. See Font. |
| format | MeterFormatCallback | null | Yes | The callback instance which format the value. |
| percentage | boolean | false | - | If true, the rendered label will show the dataset value as a percentage. |
| precision | int | 2 | - | The amount to decimals digits to apply to the value. |
Description label
The description label allows you to show a string as description inside the chart, below the value label.
// creates the dataset
MeterDataset dataset = chart.newDataset();
// enables rendering
dataset.getDescriptionLabel().setDisplay(true);
// enables rendering
dataset.getDescriptionLabel().setContent("RAM utilization");
The description label element contains all options in order to configure the rendering.
This label only apply if display options of value label is true.
The following are the attributes that you can set:
| Name | Type | Default | Scriptable | Description |
|---|---|---|---|---|
| autoFontSize | boolean | true | - | If true, the font size to applied to the rendered label is automatically calculated at runtime, otherwise uses the size property of the font. |
| color | IsColor | rgb(128, 128, 128) - | Yes | Color of the content. |
| content | String | null | Yes | The content of description label. |
| display | boolean | false | - | If true, the value label is shown. |
| font | IsFont | null | Yes | Font of rendered label. If autoFontSize is set to true, the size property is ignored because automatically calculated at runtime.The default value is the font instance in the chart options. See Font. |
Data structure
The data of a dataset for a meter chart is specified as single value.
// creates the dataset
MeterDataset dataset = chart.newDataset();
// sets the value
dataset.setValue(90.5D);
The setData methods are available, inherited by a doughnut dataset, but you can NOT use them otherwise an exception will throw.
Use setValue instead.
Options
The meter chart defines the following configuration options. It extends the doughnut options.
To set the options at chart level, you can get a typed object accordingly with the chart type.
// creates the chart
MeterChart chart = new MeterChart();
// gets options
MeterOptions options = chart.getOptions();
// sets options
options.setRender(Render.PERCENTAGE);
options.setPrecision(3);
See doughnut chart configuration how to configure the meter chart, in addition of following options:
| Name | Type | Default | Description |
|---|---|---|---|
| cutoutPercentage | String | "90%" | It can be set with a value between "80%" and "100%". |
| cutout | double | Undefined.DOUBLE | It can be set with a value of pixels if the percentage is between "80%" and "100%". |
| circumference | double | 360 | Immutable property, always 360. |
| rotation | double | 0 | Immutable property, always 0. |
The meter chart disables the legend, tooltips and animation components.
Scriptable
Scriptable options in the configuration accept a callback which is called for each animation cycle.
// creates the chart
MeterDataset dataset = chart.newDataset();
// sets the color
dataset.getValueLabel().setColor(new ColorCallback<MeterContext>(){

   @Override
   public IsColor invoke(MeterContext context){
      // logic
      return color;
   }
});
The callbacks are getting the only 1 argument, the scriptable context which contains the context of the callback execution.
The context object contains the following properties:
| Name | Type | Description |
|---|---|---|
| attributes | NativeObjectContainer | User object which you can store your options at runtime. |
| chart | IsChart | Chart instance. |
| datasetLabel | String | The label of the dataset. |
| easing | double | The easing of drawing (between 0 and 1) for animation. |
| type | ContextType | The type of the context. It can be ONLY ContextType.METER. |
| value | double | The value of meter or gauge dataset. |
The meter chart can provide scriptable options by the meter data set and the labels.
The following options can be set by a callback:
| Name | Callback | Returned types |
|---|---|---|
| color | ColorCallback<MeterContext> | String - IsColor |
| content | MeterContentCallback | String |
| font | FontCallback<MeterContext> | FontItem |
| format | MeterFormatCallback | String |
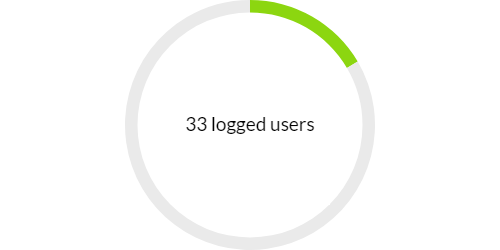
Here is an example fo value formatting.
// creates the dataset
MeterDataset dataset = chart.newDataset();
// sets the formatter
dataset.getValueLabel().setFormatCallback(new MeterFormatCallback(){

   @Override
   public String invoke(MeterContext context){
      // logic
      return Utilities.applyPrecision(context.getValue(), 0) + " logged users";
   }
});