PolarArea chart
(quoted from Polar area chart definition in Wikipedia)
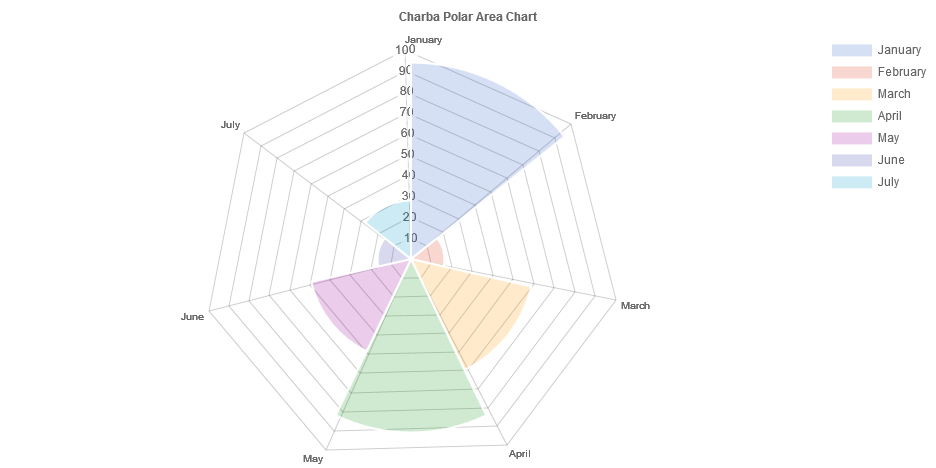
The polar area chart is similar to a usual pie chart, except sectors have equal angles and differ rather in how far each sector extends from the center of the circle. The polar area chart is used to plot cyclic phenomena.
Polar area charts are similar to pie charts, but each segment has the same angle - the radius of the segment differs depending on the value.
This type of chart is often useful when we want to show a comparison data similar to a pie chart, but also show a scale of values for context.
Programmatically, you could use a polar area chart as following:
// creates the chart
PolarAreaChart chart = new PolarAreaChart();
// adds to DOM
component.add(chart);
...
// example for Elemental2
// gets the chart instance as DOM element
Element element = chart.getChartElement().as();
// adds to DOM
DomGlobal.document.body.appendChild(element);
By UIBinder (ONLY for GWT), you could use a polar area chart as following:
<ui:UiBinder xmlns:ui="urn:ui:com.google.gwt.uibinder"
   xmlns:g="urn:import:com.google.gwt.user.client.ui"
   xmlns:c="urn:import:org.pepstock.charba.client.gwt.widgets">

   <g:HTMLPanel  width="100%">
      ....
      <c:PolarAreaChartWidget ui:field="chart"/>
      ...
   </g:HTMLPanel>
</ui:UiBinder>
Dataset
The polar area chart allows to define the data and a number of properties, used to display the data, by polar area dataset.
Every chart has got a method to create a typed dataset accordingly with the chart type. The dataset can be also created instantiating the constructor.
// creates the chart
PolarAreaChart chart = new PolarAreaChart();
// creates the dataset
PolarAreaDataset dataset = chart.newDataset();
// sets the option
dataset.setBackgroundColor(HtmlColor.RED);
...
// creates the dataset
PolarAreaDataset datasetNew = new PolarAreaDataset();
// sets the option
datasetNew.setBackgroundColor(HtmlColor.RED);
...
// sets the datasets to the chart
chart.getData().setDatasets(dataset, datasetNew);
The following are the attributes that you can set:
| Name | Type | Scriptable | Description |
|---|---|---|---|
| backgroundColor | String[] - IsColor[] - Pattern[] - Gradient[] | Yes | The fill color/pattern of the arcs in the dataset. |
| borderAlign | BorderAlign | Yes | The borders alignment of arcs. |
| borderColor | String[] - IsColor[] - Gradient[] | Yes | The border color of the arcs in the dataset. |
| borderJoinStyle | JoinStyle[] | Yes | Arc line joint style. See MDN. |
| borderWidth | int[] | Yes | The border width of the arcs in the dataset. |
| clip | boolean - double - Clip | - | How to clip relative to chart area. Positive value allows overflow, negative value clips that many pixels inside chart area. |
| circular | boolean | Yes | If the arc is curved. If false the arc will be flat. |
| hoverBackgroundColor | String[] - IsColor[] - Pattern[] - Gradient[] | Yes | The fill color/pattern of the arcs when hovered. |
| hoverBorderColor | String[] - IsColor[] - Gradient[] | Yes | The stroke color of the arcs when hovered. |
| hoverBorderJoinStyle | JoinStyle[] | Yes | Arc line joint style, when hovered. See MDN. |
| hoverBorderWidth | int[] | Yes | The stroke width of the arcs when hovered. |
| label | String | - | The label for the dataset. |
| normalized | boolean | - | If true, you provide data with indices that are unique, sorted, and consistent across data sets and provide the normalized. |
| parsing | boolean | - | If false, the data set parsing is disable. If parsing is disabled, data must be sorted and in the formats the associated chart type and scales use internally. |
General
The general options for a polar area dataset can control behaviors not related to styling or interactions and they are the following:
| Name | Defaults | Description |
|---|---|---|
| clip | Undefined.DOUBLE | How to clip relative to chart area. |
| label | null | The label for the dataset. |
| normalized | false | If true, you provide data with indices that are unique, sorted, and consistent across data sets and provide the normalized. |
| parsing | true | If false, the data set parsing is disable. If parsing is disabled, data must be sorted and in the formats the associated chart type and scales use internally. |
label options is just a pure label to add to the dataset and is NOT the label for the dataset which appears in the legend and tooltips.
Styling
The style of each arc of the dataset can be configured by the following properties:
| Name | Description |
|---|---|
| backgroundColor | The fill color of the arcs in the dataset. |
| borderAlign | The borders alignment of arcs. |
| borderColor | The border color for arcs. |
| borderJoinStyle | Arc line joint style |
| borderWidth | The width of the arc border in pixels. |
All above options have got the fallback to the associated Arc elements, retrievable by the following statements:
// from chart instance
Arc arc = chart.getOptions().getElements().getArc();
// sets options for all pie datasets of the chart
arc.setBorderWidth(3);
...
// from defaults
Arc defaultArc  = Defaults.get().getGlobal().getElements().getArc();
// sets options for all pie datasets of all charts
defaultArc.setBorderWidth(3);
Interactions
The interaction with each point can be controlled with the following properties:
| Name | Description |
|---|---|
| hoverBackgroundColor | The fill color of the arcs in the dataset when hovered. |
| hoverBorderColor | The border color for arcs when hovered. |
| hoverBorderJoinStyle | Arc line joint style when hovered. |
| hoverBorderWidth | The width of the arc border in pixels when hovered. |
All above options have got the fallback to the associated Arc elements, retrievable by the following statements:
// from chart instance
Arc arc = chart.getOptions().getElements().getArc();
// sets options for all pie datasets of the chart
arc.setBorderWidth(3);
...
// from defaults
Arc defaultArc  = Defaults.get().getGlobal().getElements().getArc();
// sets options for all pie datasets of all charts
defaultArc.setBorderWidth(3);
Scriptable
Scriptable options at dataset level accept a callback which is called for each of the underlying data values. See more details in Configuring charts section.
// creates the chart
PolarAreaChart chart = new PolarAreaChart();
// creates the dataset
PolarAreaDataset dataset = chart.newDataset();
// sets the option by a callback
dataset.setBackgroundColor(new ColorCallback<DatasetContext>(){

   @Override
   public IsColor invoke(DatasetContext context){
      // logic
      return color;
   }
});
The following options can be set by a callback:
| Name | Callback | Returned types |
|---|---|---|
| backgroundColor | ColorCallback<DatasetContext> | String - IsColor - Pattern - Gradient |
| borderAlign | BorderAlignCallback | BorderAlign |
| borderColor | ColorCallback<DatasetContext> | String - IsColor - Gradient |
| borderJoinStyle | JoinStyleCallback<DatasetContext> | JoinStyle |
| borderWidth | WidthCallback<DatasetContext> | int |
| circular | CircularCallback | boolean |
| hoverBackgroundColor | ColorCallback<DatasetContext> | String - IsColor - Pattern - Gradient |
| hoverBorderColor | ColorCallback<DatasetContext> | String - IsColor - Gradient |
| hoverBorderJoinStyle | JoinStyleCallback<DatasetContext> | JoinStyle |
| hoverBorderWidth | WidthCallback<DatasetContext> | int |
Data structure
The data of a dataset for a polar area chart is specified as a an array of numbers. Each point in the data array corresponds to the label at the same index on the axis.
// sets data as an array of doubles
dataset.setData(1,2,3,4,6);

// sets data as a list of double
List<Double> list = new LinkedList<>();
list.add(1);
list.add(2);
list.add(3);
dataset.setData(list);
To provide context of what each point means, we include an array of strings that show around each point in the chart.
...
chart.getData().setLabels("label1", "label2");
...