Datasets items selector plugin
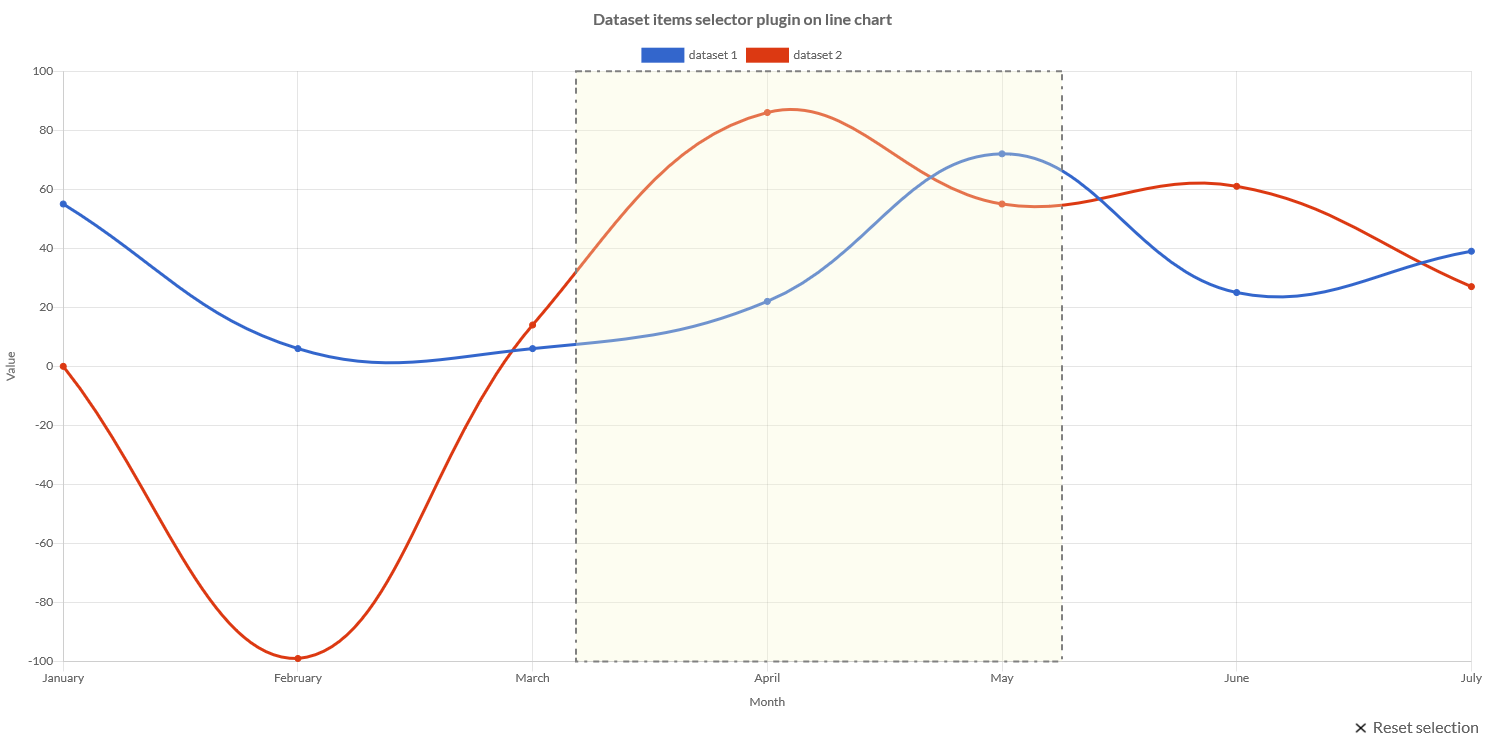
Charba provides an plugin implementation to select an area on the chart which represents a set of datasets items of the chart and inform you by event about the range of datasets items selected.
The goal is to enable selections of a subset of datasets, zooming and drill down/up of the data on chart instance.
This plugin, as singleton, can be set both at global and at chart level.
The implementation is DatasetsItemsSelector and can be set as following:
// ---------------------------------
// Registers as global plugin
// ---------------------------------
Defaults.get().getPlugins().register(DatasetsItemsSelector.get());
// ---------------------------------
// Registers as single chart plugin
// ---------------------------------
chart.getPlugins().add(DatasetsItemsSelector.get());
The ID of plugin is charbadatasetsitemsselector (DatasetsItemsSelector.ID).
Options
It could be that you set this plugin as global one for all your charts but you want to change it for only one instance.
In this case you should instantiate a DatasetsItemsSelectorOptions and set it to your chart options as following, setting the color you want:
// creates a plugin options
DatasetsItemsSelectorOptions options = new DatasetsItemsSelectorOptions();
// Set "green" by HtmlColor
options.setColor(HtmlColor.GREEN);

// --------------------------------------
// STORING plugin options
// --------------------------------------
// stores the plugin options by plugin ID
chart.getOptions().getPlugin().setOptions(DatasetsItemsSelector.ID, options);
// stores the plugin options without plugin ID
chart.getOptions().getPlugin().setOptions(options);
// stores the plugin options directly by the options
options.store(chart);
You can also change the default for all charts instances, as following
// creates a plugin options
DatasetsItemsSelectorOptions options = new DatasetsItemsSelectorOptions();
// Set "green" by HtmlColor
options.setColor(HtmlColor.GREEN);

// --------------------------------------
// STORING plugin options
// --------------------------------------
// stores the plugin options by plugin ID
Defaults.get().getGlobal().getPlugin().setOptions(DatasetsItemsSelector.ID, options);
// stores the plugin options without plugin ID
Defaults.get().getGlobal().getPlugin().setOptions(options);
// stores the plugin options directly by the options
options.store();
If you need to read the plugin options, there is the specific factory, DatasetsItemsSelectorOptionsFactory as static reference inside the plugin which can be used to retrieve the options from chart, as following:
// gets options reference
DatasetsItemsSelectorOptions options;

// --------------------------------------
// GETTING plugin options from chart
// --------------------------------------
if (chart.getOptions().getPlugin().hasOptions(DatasetsItemsSelector.ID)){
   // retrieves the plugin options by plugin ID
   options = chart.getOptions().getPlugin().getOptions(DatasetsItemsSelector.ID, DatasetsItemsSelector.FACTORY);
   //retrieves the plugin options without plugin ID
   options = chart.getOptions().getPlugin().getOptions(DatasetsItemsSelector.FACTORY);
}
The following are the attributes that you can set to plugin options:"#ffcc80"
| Name | Type | Default | Description |
|---|---|---|---|
| borderColor | String - IsColor | rgb(97, 97, 97) - | The border color of the selected area. |
| borderDash | int[] | [] | The line dash pattern used when stroking lines, using an array of values which specify alternating lengths of lines and gaps which describe the pattern. |
| borderDashOffset | double | 0 | Offset for line dashes. See MDN |
| borderWidth | int | 0 | The border width of the selected area. |
| color | String - IsColor | rgba(255, 204, 128, 0.3) - | The color of selected area on chart. |
| enabled | boolean | true | If true, the plugin is enabled. |
| enabledClearByEscape | boolean | true | If true, the selection can be clear pressing Escape key. |
| modifierKey | ModifierKey | null | Keyboard modifier key which must be pressed to enable the selection. |
| xAxisID | String - ScaleId | DefaultScaleId.X | The ID of the X axis to use to calculate the amount of selectable items. |
| yAxisID | String - ScaleId | null | The ID of the Y axis to use to calculate the area selections. If null, the chart area size is used. To use for stacked axes. |
Selection cleaner
Every options has got a inner element to set selection cleaner options. The selection cleaner element allows to reset the selection directly from the chart.
It adds a label and/or image on top or bottom of the chart which will be visible only when there is a selection on datasets. Clicking on the element, the selection on chart is removed.
// creates a plugin options
DatasetsItemsSelectorOptions options = new DatasetsItemsSelectorOptions();
// sets the options to selection cleaner configuration element
options.getSelectionCleaner().setDisplay(true);
options.getSelectionCleaner().getFont().setSize(18);
options.getSelectionCleaner().setAlign(Align.RIGHT_CHART_AREA);
options.getSelectionCleaner().setPosition(Position.BOTTOM);
options.getSelectionCleaner().setRender(Render.IMAGE_LABEL);
options.getSelectionCleaner().setUseSelectionStyle(true);
The complete options are described by following table:
| Name | Type | Default | Description |
|---|---|---|---|
| display | boolean | false | If true the element will be showed to chart. |
| label | String | "Reset selection" | The label to show in the element. |
| font | IsFont | See description | Font of selection cleaner label. The default value is the global font. See Font. |
| color | String - IsColor | rgb(97, 97, 97) - | The font color of label. |
| align | Align | Align.RIGHT | Alignment of element. |
| position | Position | Position.BOTTOM | Position of the element in the chart. left and right are ignored and use bottom. |
| image | Img | null | The image to show in the element. |
| render | Render | Render.LABEL | Defines if label or image or both will e showed in the element. |
| margin | int | 2 | The distance with the canvas borders. |
| padding | int | 4 | The padding around the render element. |
| spacing | int | 3 | The distance between image and label in the element. |
| useSelectionStyle | boolean | false | If true the element will use the style used for selection area. |
Actions and events
The plugin can emit events when
- the selection of area on chart has been finished, an event will fire passing the range of the selected datasets items.
- the selection area is resetted, an event will fire.
Furthermore it provides a set of methods in order to set and clean selection programmatically.
Selecting dataset items
To set a selection programmatically, the plugin provides 3 methods:
setSelection(IsChart chart, String from, String to)which selects on the chart using the axis values passed as argument; being strings, this method should be used on cartesian category axessetSelection(IsChart chart, double from, double to)which selects on the chart using the axis values passed as argument; being numbers, this method should be used on cartesian linear or cartesian logarithmic axessetSelection(IsChart chart, Date from, Date to)which selects on the chart using the axis values passed as argument; being dates, this method should be used on cartesian time or cartesian time series axes
Here is a simple example:
protected void handleSelect() {
    // selects the area between "February" and "April" labels
    DatasetsItemsSelector.get().setSelection(chart, "February", "April");
}
To catch the event and manage it, you can add a DatasetRangeSelectionEventHandler instance to the chart options, as following:
chart.addHandler(new DatasetRangeSelectionEventHandler(){

   /**
    * Invoked when the user selects an area on the chart.
    *
    * @param event chart data set selection event
    */
   @Override
   public void onSelect(DatasetRangeSelectionEvent event){
      // logic
   }

}, DatasetRangeSelectionEvent.TYPE);
The event provides 2 methods to get the range of the selected data sets:
getFrom()provides the starting value on data sets, by a scale item.getTo()provides the ending value on data sets, by a scale item.
Cleaning selection
To reset a selection programmatically, without using selection cleaner element, the plugin provides 2 methods:
cleanSelection(IsChart chart)which resets the selected area on passed chart instance firing event on reset if a clean selection handler has been configured.cleanSelection(IsChart chart, boolean fireEvent)which resets the selected area on passed chart instance, setting if the event must be fired
Here is a simple example:
protected void reset() {
    // removes the area, previously selected
    DatasetsItemsSelector.get().cleanSelection(chart);
}
To catch the event and manage it, you can add a DatasetRangeCleanSelectionEventHandler instance to the chart options, as following:
chart.addHandler(new DatasetRangeCleanSelectionEventHandler(){

    /**
     * Invoked when the user cleans an area on the chart.
     *
     * @param event chart data set clean selection event
     */
    @Override
    public void onClean(DatasetRangeCleanSelectionEvent event){
      // logic
    }

}, DatasetRangeCleanSelectionEvent.TYPE);
To update a current selection is NOT mandatory to reset it but it's enough to re-select new area on the chart.
Options builder
Charba provides a builder to create options using the set methods in sequence and get the options object at the end of configuration.
// creates the plugin options
DatasetsItemsSelectorOptions options = DatasetsItemsSelectorOptionsBuilder.create()
    .setBorderWidth(5)
    .setBorderDash(6, 2, 3)
    .setDisplay(true)
    .setFontSize(18)
    .setAlign(Align.RIGHT_CHART_AREA)
    .setUseSelectionStyle(true)
    .build();
// sets plugin options
chart.getOptions().getPlugins().setOptions(DatasetsItemsSelector.ID, options);