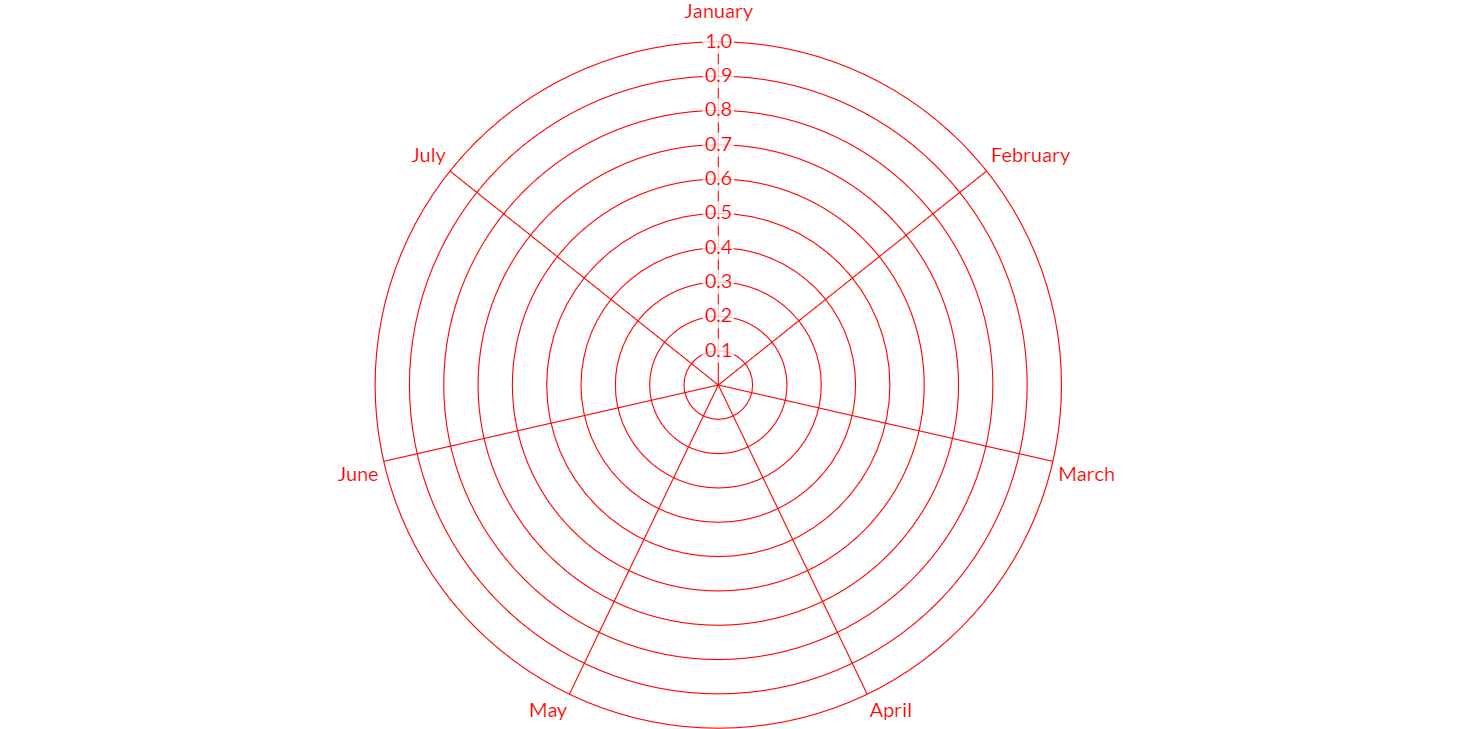
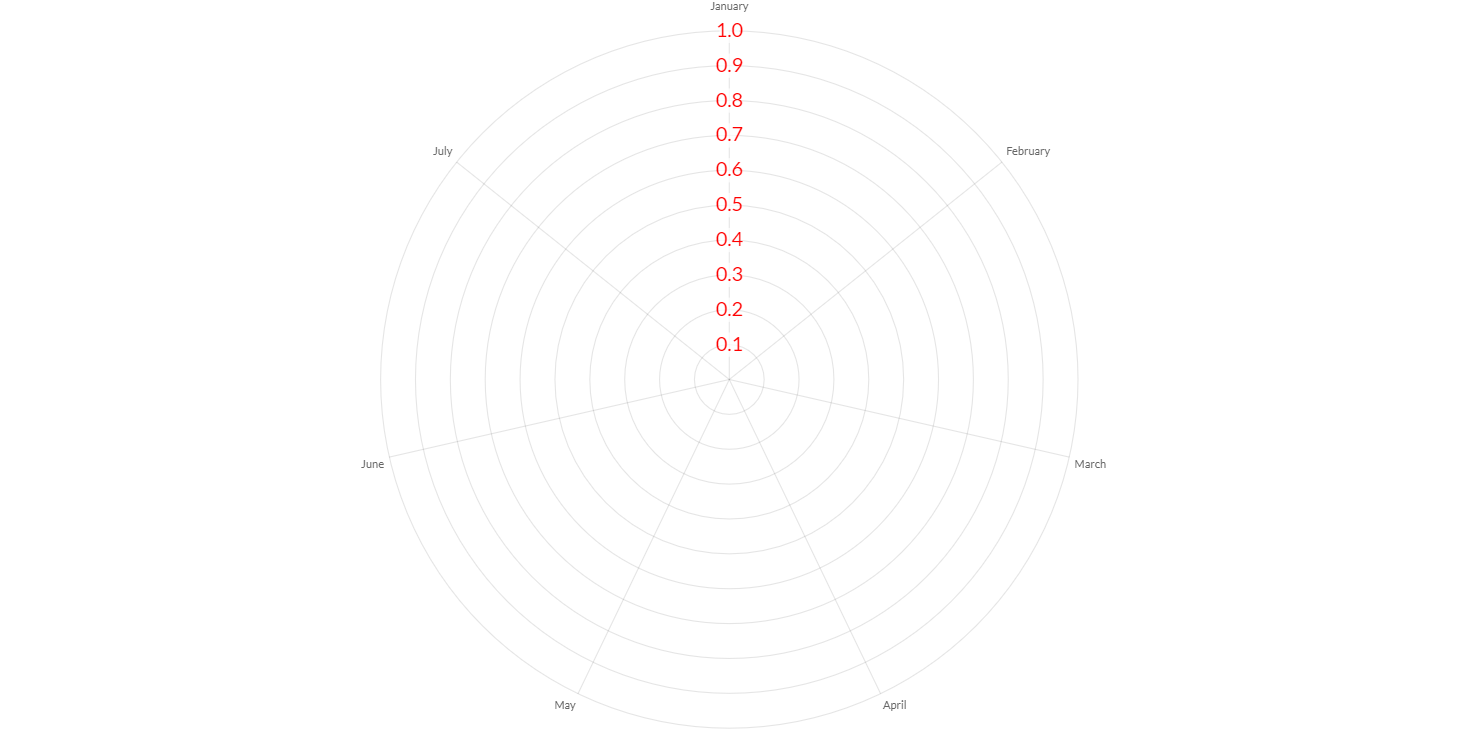
Radial Axes
Radial axes are used specifically for the radar and polar area chart types. These axes overlay the chart area, rather than being positioned on one of the edges.
Radial axes could be only
- linear, is use to chart numerical data. As the name suggests, linear interpolation is used to determine where a value lies in relation the center of the axis.
The radial axis is use to chart numerical data.
Here is an example how to create a radial axis:
// creates a radial axis with default scale id "r" and default kind "r"
RadialAxis axis = new RadialAxis(chart);

// adds axes to chart configuration
chart.getOptions().setAxes(axis);
The axis has configuration properties for ticks, angle lines (line that appear in a radar chart outward from the center), point labels (labels around the edge in a radar chart):
Options
The radial linear axis allows to define a number of properties, used to display the data.
// creates a radial axis
RadialAxis axis = new RadialAxis(chart);
// sets and gets the max value
axis.setMax(100);

double max = axis.getMax();
The following are the attributes that you can set:
| Name | Type | Scriptable | Description |
|---|---|---|---|
| alignToPixels | boolean | Yes | Align pixel values to device pixels. |
| animate | boolean | - | If true, animate scaling the chart from the center. |
| backgroundColor | String - IsColor | Yes | The background color of scale area. |
| beginAtZero | boolean | Yes | If true, scale will include 0 if it is not already included. |
| display | boolean - Display | Yes | If Display.TRUE, the axis is shown. |
| max | double | Yes | User defined maximum number for the scale, overrides maximum value from data. |
| min | double | Yes | User defined minimum number for the scale, overrides minimum value from data. |
| reverse | boolean | Yes | Reverses order of tick labels. |
| startAngle | double | Yes | Starting angle to draw arcs for the first item in a data set. In degrees, 0 is at top. |
| suggestedMax | double | Yes | Adjustment used when calculating the maximum data value. |
| suggestedMin | double | Yes | Adjustment used when calculating the minimum data value. |
| weight | double | Yes | The weight used to sort the axis. Higher weights are further away from the chart area. |
Scriptable
Scriptable options at scale level accept a callback which is called for each of the underlying data values. See more details in Configuring charts section.
All scriptable options callbacks will get a ScaleContext instance.
// creates a category axis
RadialAxis axis = new RadialAxis(chart);
// sets the option by a callback
axis.setBackgroundColor(new ColorCallback<ScaleContext>(){

   @Override
   public IsColor invoke(ScaleContext context){
      // logic
      return color;
   }
});
The following options can be set by a callback:
| Name | Callback | Returned types |
|---|---|---|
| alignToPixels | AlignToPixelsCallback | boolean |
| backgroundColor | ColorCallback<ScaleContext> | String - IsColor |
| beginAtZero | BeginAtZeroCallback | boolean |
| display | DisplayCallback | boolean - Display |
| max | MinMaxCallback<Double> | double |
| min | MinMaxCallback<Double> | double |
| reverse | ReverseCallback | boolean |
| startAngle | StartAngleCallback | double |
| suggestedMax | MinMaxCallback<Double> | double |
| suggestedMin | MinMaxCallback<Double> | double |
| weight | ScaleWeightCallback | double |
Ticks
The radial linear axis provides the following options for configuring tick marks.
// creates a radial axis
RadialAxis axis = new RadialAxis(chart);
// sets and gets the max value
axis.getTicks().setColor(HtmlColor.RED);

IsColor color = axis.gteTicks().getColor();
The following are the attributes that you can set:
| Name | Type | Scriptable | Description |
|---|---|---|---|
| backdropColor | String - IsColor | Yes | Color of label backdrops. |
| backdropPadding | Padding | The padding of tick backdrop. See padding documentation for more details. | |
| color | String - IsColor | Yes | Color of ticks. |
| count | int | [Yes](#ticks-scriptable-options | The number of ticks to generate. If specified, this overrides the automatic generation. |
| display | boolean | - | If true, the tick marks are shown. |
| font | IsFont | Yes | Font of ticks. See Font. |
| maxTicksLimit | int | [Yes](#ticks-scriptable-options | Maximum number of ticks and gridlines to show. |
| numberFormat | NumberFormatOptions | Yes | The number format options used by the default label formatter. See INTL number format documentation. |
| padding | int | - | The padding between the tick label and the axis. |
| precision | int | [Yes](#ticks-scriptable-options | If defined and stepSize is not specified, the step size will be rounded to this many decimal places. |
| sampleSize | int | - | The number of ticks to examine when deciding how many labels will fit. Setting a smaller value will be faster, but may be less accurate when there is large variability in label length. |
| showLabelBackdrop | boolean | Yes | If true, draw a background behind the tick labels |
| stepSize | double | Yes | User defined fixed step size for the scale. |
| textStrokeColor | String - IsColor | Yes | The color of the stroke around the text. |
| textStrokeWidth | int | Yes | Stroke width around the text. |
| z | int | - | z-index of tick layer. Useful when ticks are drawn on chart area. Values less than or equals to 0 are drawn under data sets, greater than 0 on top. |
The further customization of ticks, a callback is provided.
See [padding documentation](../configuration/Commons#padding) for more details.
Ticks scriptable options
Scriptable options at ticks level accept a callback which is called for each of the underlying data values. See more details in Configuring charts section.
All scriptable options callbacks will get a ScaleContext instance.
// creates a radial axis
RadialAxis axis = new RadialAxis(chart);
// sets the option by a callback
axis.getTicks().setColor(new ColorCallback<ScaleContext>(){

   @Override
   public IsColor invoke(ScaleContext context){
      // logic
      return color;
   }
});
The following options can be set by a callback:
| Name | Callback | Returned types |
|---|---|---|
| backdropColor | ColorCallback<ScaleContext> | String - IsColor |
| color | ColorCallback<ScaleContext> | String - IsColor |
| count | CountCallback | int |
| font | FontCallback<ScaleContext> | FontItem |
| maxTicksLimit | MaxTicksLimitCallback | int |
| numberFormat | NumberFormatCallback | NumberFormatItem |
| precision | PrecisionCallback | int |
| showLabelBackdrop | ShowLabelBackdropCallback | boolean |
| stepSize | StepSizeCallback | double |
| textStrokeColor | ColorCallback<ScaleContext> | String - IsColor |
| textStrokeWidth | WidthCallback<ScaleContext> | int |
Callback
It is also common to want to change the tick marks to include information about the data type. For example, adding a dollar sign ('$'). To do this, you need to implement a ticks callback in the axis configuration.
To apply a custom callback, you can set a TickCallback instance to the axis options, as following:
axis.getTicks().setCallback(new TickCallback(){

   /**
    * Changes the tick marks to include information about the data type.
    *
    * @param axis axis instance where this callback as been defined
    * @param value value of tick
    * @param index index of tick
    * @param values list of all tick values
    * @return the tick to apply or if the callback returns null the associated grid line will be hidden.
    */
   public String onCallback(Axis axis, double value, int index, List<Double> values){
      // add $
      return "$" + value;
   }

});
See INTL number format documentation if you want to use a number formatter, provided out-of-the-box.
NoSelectedDatasetTicksCallback callback
Charba provides a common implementation for tick callback to set the decimal digits of ticks in case of all data sets are hidden, to avoid the annoying standard format of doubles.
To apply the callback, you can set an instance to the axis options, as following:
// creates a radial axis
RadialAxis axis = new RadialAxis(chart);
// sets the option by a callback
axis.getTicks().setCallback(new NoSelectedDatasetTicksCallback());
The default decimal precision is 2. A custom precision can be set by the constructor of callback, as following:
// creates a radial axis
RadialAxis axis = new RadialAxis(chart);
// sets the option by a callback
// 3 decimal digits
axis.getTicks().setCallback(new NoSelectedDatasetTicksCallback(3));