Cartesian Logarithmic Axes
The logarithmic axis is use to chart numerical data. It can be placed on either the x or y axis. As the name suggests, logarithmic interpolation is used to determine where a value lies on the axis.
Here are some example how to create logarithmic axes:
// creates a logarithmic axis with default scale id "y" and default kind "y"
CartesianLogarithmicAxis axis1 = new CartesianLogarithmicAxis(chart);

// creates a logarithmic axis with scale id "my-axis" and default kind "y"
CartesianLogarithmicAxis axis2 = new CartesianLogarithmicAxis(chart, "my-axis");

// creates a logarithmic axis with scale id "my-axis" and default kind "y"
CartesianLogarithmicAxis axis3 = new CartesianLogarithmicAxis(chart, ScaleId.create("my-axis"));

// creates a logarithmic axis with default scale id "y" and custom kind "y"
CartesianLogarithmicAxis axis4 = new CartesianLogarithmicAxis(chart, AxisKind.Y);

// creates a logarithmic axis with scale id "my-axis" and custom kind "y"
CartesianLogarithmicAxis axis5 = new CartesianLogarithmicAxis(chart, "my-axis", AxisKind.Y);

// creates a logarithmic axis with scale id "my-axis" and custom kind "y"
ScaleId myAxis = ScaleId.create("my-axis");
CartesianLogarithmicAxis axis6 = new CartesianLogarithmicAxis(chart, myAxis, AxisKind.Y);

// adds axes to chart configuration
chart.getOptions().setAxes(axis1, ...);
Options
The cartesian logarithmic axis allows to define a number of properties, used to display the data.
// creates a logarithmic axis
CartesianLogarithmicAxis axis = new CartesianLogarithmicAxis(chart);
// sets and gets the max value
axis.setMax(10000);

double max = axis.getMax();
The following are the attributes that you can set:
| Name | Type | Scriptable | Description |
|---|---|---|---|
| alignToPixels | boolean | Yes | Align pixel values to device pixels. |
| backgroundColor | String - IsColor | Yes | The background color of scale area. |
| bounds | Bounds | Yes | Determines the scale bounds on axis. |
| display | boolean - Display | Yes | If Display.TRUE, the axis is shown. |
| max | double | Yes | User defined maximum number for the scale, overrides maximum value from data. |
| min | double | Yes | User defined minimum number for the scale, overrides minimum value from data. |
| offset | boolean | Yes | If true, extra space is added to the both edges and the axis is scaled to fit in the chart area. |
| position | AxisPosition - AxisPositionItem | Yes | Position of the axis. |
| reverse | boolean | Yes | Reverses order of tick labels. |
| singleStacked | boolean | - | If you might want to stack positive and negative values together. |
| stack | String | Yes | Sets the stack group. Axes at the same position with same stack are stacked. |
| stacked | boolean | Yes | If the axis are stacked. |
| stackWeight | double | Yes | Sets the weight of the scale in stack group. Used to determine the amount of allocated space for the scale within the group. |
| suggestedMax | double | Yes | Adjustment used when calculating the maximum data value. |
| suggestedMin | double | Yes | Adjustment used when calculating the minimum data value. |
| weight | double | Yes | The weight used to sort the axis. Higher weights are further away from the chart area. |
Scriptable
Scriptable options at scale level accept a callback which is called for each of the underlying data values. See more details in Configuring charts section.
All scriptable options callbacks will get a ScaleContext instance.
// creates a category axis
CartesianLogarithmicAxis axis = new CartesianLogarithmicAxis(chart);
// sets the option by a callback
axis.setBackgroundColor(new ColorCallback<ScaleContext>(){

   @Override
   public IsColor invoke(ScaleContext context){
      // logic
      return color;
   }
});
The following options can be set by a callback:
| Name | Callback | Returned types |
|---|---|---|
| alignToPixels | AlignToPixelsCallback | boolean |
| backgroundColor | ColorCallback<ScaleContext> | String - IsColor |
| bounds | BoundsCallback | Bounds |
| display | DisplayCallback | boolean - Display |
| max | MinMaxCallback<Double> | double |
| min | MinMaxCallback<Double> | double |
| offset | ScaleOffsetCallback | boolean |
| position | ScalePositionCallback | AxisPosition - AxisPositionItem |
| reverse | ReverseCallback | boolean |
| stack | StackCallback | String |
| stacked | StackedCallback | boolean |
| stackWeight | ScaleWeightCallback | double |
| suggestedMax | MinMaxCallback<Double> | double |
| suggestedMin | MinMaxCallback<Double> | double |
| weight | ScaleWeightCallback | double |
Ticks
The logarithmic axis provides the following options for configuring tick marks.
// creates a logarithmic axis
CartesianLogarithmicAxis axis = new CartesianLogarithmicAxis(chart);
// sets and gets the max value
axis.getTicks().setColor(HtmlColor.RED);

IsColor color = axis.gteTicks().getColor();
The following are the attributes that you can set:
| Name | Type | Scriptable | Description |
|---|---|---|---|
| align | TickAlign | - | The tick alignment along the axis. |
| autoSkip | boolean | - | If true, automatically calculates how many labels that can be shown and hides labels accordingly. Labels will be rotated up to maxRotation before skipping any. Turn autoSkip off to show all labels no matter what. |
| autoSkipPadding | int | - | The padding between the ticks on the horizontal axis when autoSkip is enabled. |
| backdropColor | String - IsColor | Yes | Color of label backdrops. |
| backdropPadding | Padding | - | The padding of tick backdrop. See padding documentation for more details. |
| color | String - IsColor | Yes | Color of ticks. |
| crossAlign | CrossAlign | - | The tick alignment perpendicular to the axis. |
| display | boolean | - | If true, the tick marks are shown. |
| font | IsFont | Yes | Font of ticks. See Font. |
| includeBounds | boolean | - | If true, the defined min and max values should be presented as ticks even if they are not "nice". |
| labelOffset | int | - | Distance in pixels to offset the label from the centre point of the tick (in the x-direction for the x-axis, and the y-direction for the y-axis). Note: This can cause labels at the edges to be cropped by the edge of the canvas. |
| maxRotation | int | - | The maximum rotation for tick labels when rotating to condense labels. Note: Rotation doesn't occur until necessary and only applicable to horizontal scales. |
| minRotation | int | - | The minimum rotation for tick labels. |
| mirror | boolean | - | The flips tick labels around axis, displaying the labels inside the chart instead of outside. Note: Only applicable to vertical scales. |
| numberFormat | NumberFormatOptions | Yes | The number format options used by the default label formatter. See INTL number format documentation |
| padding | int | - | The padding between the tick label and the axis. |
| sampleSize | int | - | The number of ticks to examine when deciding how many labels will fit. Setting a smaller value will be faster, but may be less accurate when there is large variability in label length. |
| showLabelBackdrop | boolean | Yes | If true, draw a background behind the tick labels |
| textStrokeColor | String - IsColor | Yes | The color of the stroke around the text. |
| textStrokeWidth | int | Yes | Stroke width around the text. |
| z | int | - | z-index of tick layer. Useful when ticks are drawn on chart area. Values less than or equals to 0 are drawn under data sets, greater than 0 on top. |
The further customization of ticks, a callback is provided.
Ticks scriptable options
Scriptable options at ticks level accept a callback which is called for each of the underlying data values. See more details in Configuring charts section.
All scriptable options callbacks will get a ScaleContext instance.
// creates a logarithmic axis
CartesianLogarithmicAxis axis = new CartesianLogarithmicAxis(chart);
// sets the option by a callback
axis.getTicks().setColor(new ColorCallback<ScaleContext>(){

   @Override
   public IsColor invoke(ScaleContext context){
      // logic
      return color;
   }
});
The following options can be set by a callback:
| Name | Callback | Returned types |
|---|---|---|
| backdropColor | ColorCallback<ScaleContext> | String - IsColor |
| color | ColorCallback<ScaleContext> | String - IsColor |
| font | FontCallback<ScaleContext> | FontItem |
| numberFormat | NumberFormatCallback | NumberFormatItem |
| showLabelBackdrop | ShowLabelBackdropCallback | boolean |
| textStrokeColor | ColorCallback<ScaleContext> | String - IsColor |
| textStrokeWidth | WidthCallback<ScaleContext> | int |
Callback
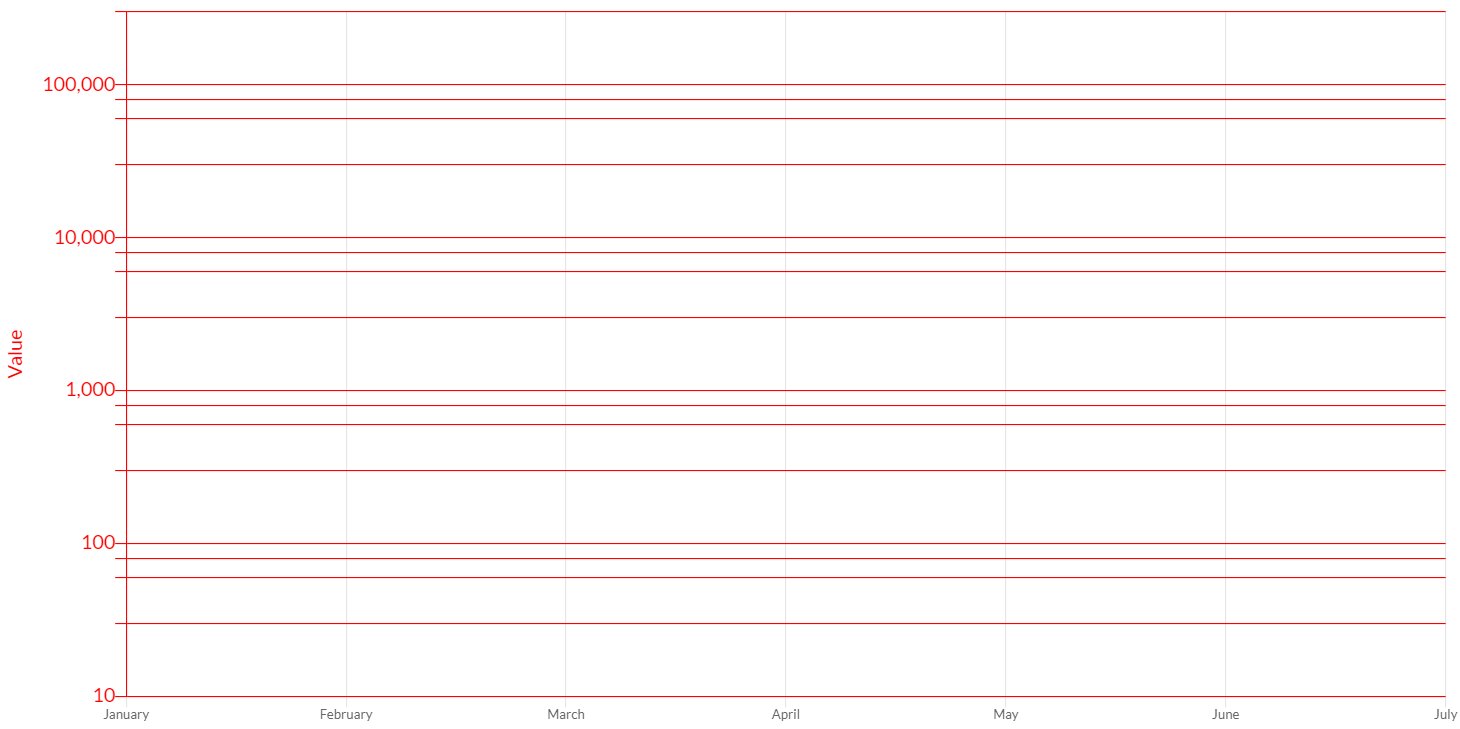
It is also common to want to change the tick marks to include information about the data type. For example, adding a dollar sign ('$'). To do this, you need to implement a ticks callback in the axis configuration.
To apply a custom callback, you can set a TickCallback instance to the axis options, as following:
axis.getTicks().setCallback(new TickCallback(){

   /**
    * Changes the tick marks to include information about the data type.
    *
    * @param axis axis instance where this callback as been defined
    * @param value value of tick
    * @param index index of tick
    * @param values list of all tick values
    * @return the tick to apply or if the callback returns null the associated grid line will be hidden.
    */
   public String onCallback(Axis axis, double value, int index, List<Double> values){
      // add $
      return "$" + value;
   }

});
See INTL number format documentation if you want to use a number formatter, provided out-of-the-box.
The callback can return a string (for single line) or a list of strings (for multiple lines).
NoSelectedDatasetTicksCallback callback
Charba provides a common implementation for tick callback to set the decimal digits of ticks in case of all data sets are hidden, to avoid the annoying standard format of doubles.
To apply the callback, you can set an instance to the axis options, as following:
// creates a logarithmic axis
CartesianLogarithmicAxis axis = new CartesianLogarithmicAxis(chart);
// sets the option by a callback
axis.getTicks().setCallback(new NoSelectedDatasetTicksCallback());
The default decimal precision is 2. A custom precision can be set by the constructor of callback, as following:
// creates a logarithmic axis
CartesianLogarithmicAxis axis = new CartesianLogarithmicAxis(chart);
// sets the option by a callback
// 3 decimal digits
axis.getTicks().setCallback(new NoSelectedDatasetTicksCallback(3));