Gradient plugin
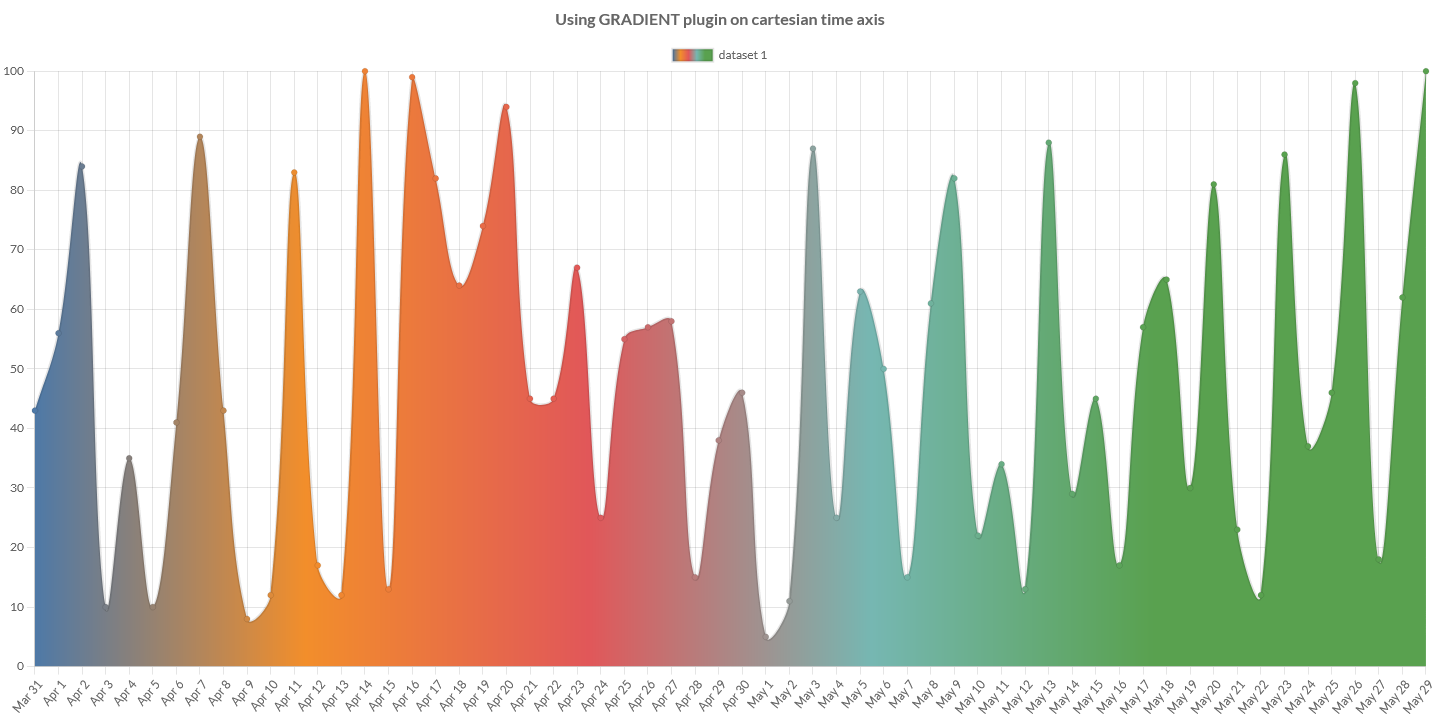
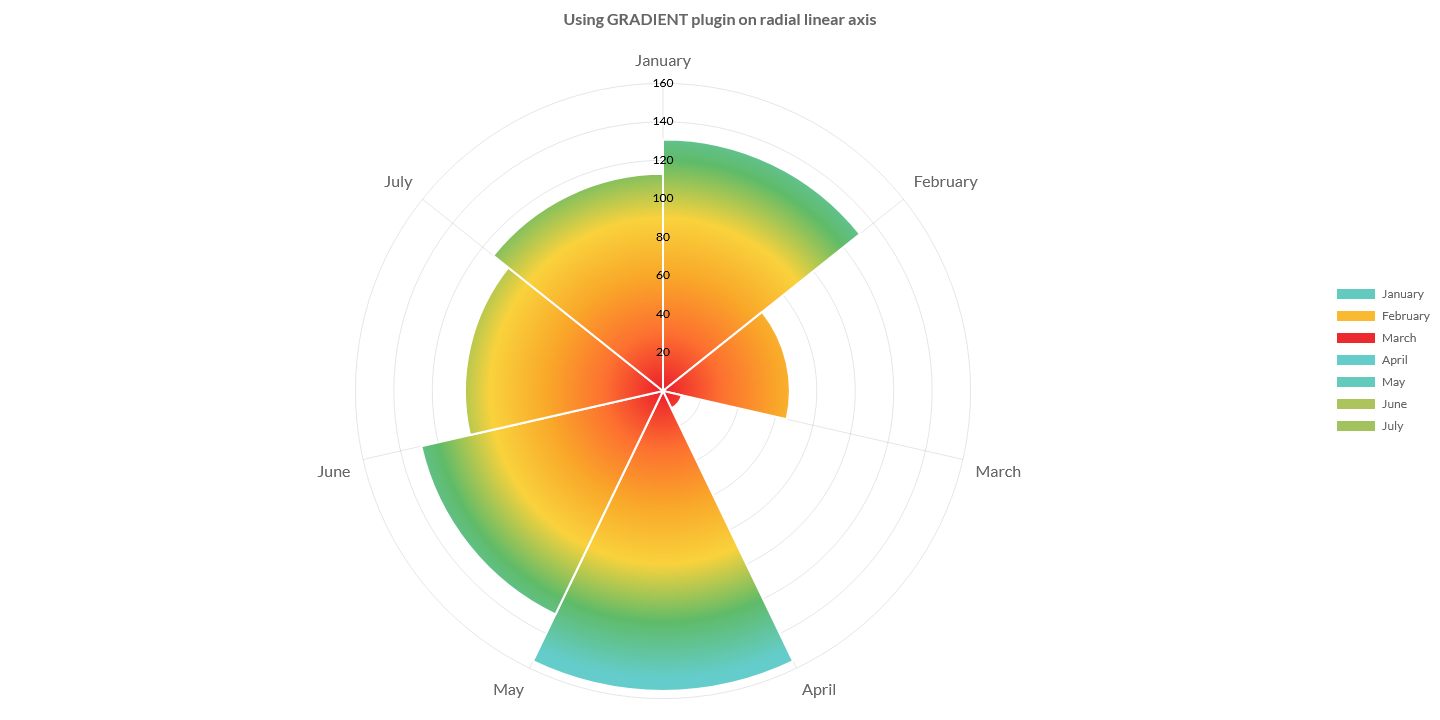
Charba provides out of the box the feature to enable Gradient which is a light weight plugin to apply gradients to the datasets by data values.
Activation
The gradient plugin is injected directly in the document.
The plugin ID is a constant everywhere available, GradientPlugin.ID, in GradientPlugin entry point.
This plugin registers itself globally, meaning that once injected, all charts will enable zooming. In case you want it enabled only for a few charts, you can enable it as following:
// --------------------------------------
// enabling the plugin without any parameter
// the plugin is NOT registered to all charts
// --------------------------------------
GradientPlugin.enable();

// --------------------------------------
// enabling the plugin with `true` parameter
// the plugin is registered to all charts
// --------------------------------------
GradientPlugin.enable(true);
To activate the plugin in a specific chart, it's enough to provide the configuration options (see below) to the datasets, which should be rendered by the gradient, or enabling it by:
// --------------------------------------
// ENABLING the plugin to a chart instance
// storing a plugin options
// --------------------------------------
// creates chart
LineChart chart = new LineChart();
// creates dataset
LineDataset dataset = chart.newDataset();
// creates a plugin options
GradientOptions options = new GradientOptions();
// gets background color property options
PropertyOptions propOptions = options.getBackgroundColor();
// sets axis kind to apply gradient
propOptions.setAxis(AxisKind.Y);
// gets colors
Colors stopColors = propOptions.getColors();
// sets color at different data value
stopColors.setColor(0, HtmlColor.GREEN);
stopColors.setColor(50, HtmlColor.YELLOW);
stopColors.setColor(100, HtmlColor.RED);
// sets plugin options to dataset
dataset.setOptions(options);
Configuration
The plugin options can be changed at only at dataset level by dataset.setOptions method.
The configuration class GradientOptions contains all properties needed to configure the plugin.
The complete options are described by following table:
| Name | Type | Description |
|---|---|---|
| backgroundColor | PropertyOptions | Sets the gradient as background color of the dataset. |
| borderColor | PropertyOptions | Sets the gradient as border color of the dataset. |
| hoverBackgroundColor | PropertyOptions | Sets the gradient as background color of the dataset, when hovered. |
| hoverBorderColor | PropertyOptions | Sets the gradient as border color of the dataset, when hovered. |
| pointBackgroundColor | PropertyOptions | Sets the gradient as background color of the points of the dataset. |
| pointBorderColor | PropertyOptions | Sets the gradient as border color of the points of the dataset. |
| pointHoverBackgroundColor | PropertyOptions | Sets the gradient as background color of the points of the dataset, when hovered. |
| pointHoverBorderColor | PropertyOptions | Sets the gradient as border color of the points of the dataset, when hovered |
Property options
The property option enables the configuration of the gradient, like the orientation, based on the axis related to the dataset, and the colors for a specific dataset option.
// creates a plugin options
GradientOptions options = new GradientOptions();
// gets background color property options
PropertyOptions propOptions = options.getBackgroundColor();
// sets axis kind to apply gradient
propOptions.setAxis(AxisKind.Y);
The complete options are described by following table:
| Name | Type | Description |
|---|---|---|
| axis | AxisKind | The axis to use for applying the gradient to the dataset. |
| colors | Colors | Sets the colors to composed the gradient |
Colors
The colors option enables to adds color stop, defined by a data value and a color, to a given canvas gradient.
// creates a plugin options
GradientOptions options = new GradientOptions();
// gets background color property options
PropertyOptions propOptions = options.getBackgroundColor();
// sets axis kind to apply gradient
propOptions.setAxis(AxisKind.Y);
// gets colors
Colors stopColors = propOptions.getColors();
// sets color at different data value
stopColors.setColor(0, HtmlColor.GREEN);
stopColors.setColor(50, HtmlColor.YELLOW);
stopColors.setColor(100, HtmlColor.RED);
The colors stop data value can be a String, double or a date, related to the axis defined to be used for gradient creation.